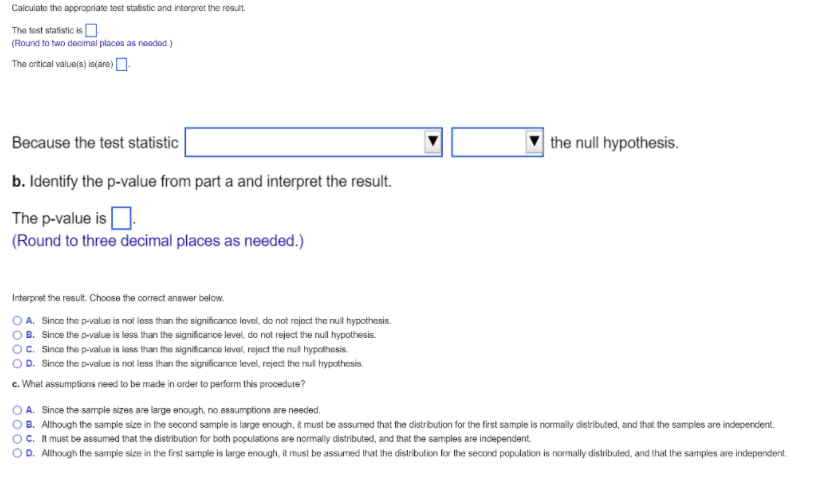
The following table shows the average hourly wage rates for day-care centers from two locations based on two random samples. Use the table to complete parts a through c. Location 1 Location 2 Sample mean $9.67 $8.65 Sample standard deviation $1.21 $1.19 Sample size 28 32 a. Perform a hypothesis test, using o =0.10, to determine if the average hourly wage for day-care workers in Location 1 is $0.50 per hour higher than the average hourly wage for day-care workers in Location 2. Assume the population variances for wage rates in each location are equal. Determine the null and alternative hypotheses for the test. Ho: Hy - H2 5 $0.50 Hy: Hy - H2 > $0.50 Calculate the appropriate test statistic and interpret the result. The test statistic is]. (Round to two decimal places as needed.)Calculate the appropriate tost statistic and interpret the result. The Most statistic is (Round to two docimal places as nodded.) The critical value(s) is(are)]- Because the test statistic the null hypothesis. b. Identify the p-value from part a and interpret the result. The p-value is (Round to three decimal places as needed.) Interpret the result. Choose the correct answer below. O A. Since the p-value is not loss than the significance level, do not reject the null hypothesis. O B. Since the p-value is less than the significance level, do not reject the null hypothesis. O C. Since the p-value is less than the significance level, reject the nul hypothesis. O D. Since the p-value is not less than the significance level, reject the null hypothesis. c. What assumptions need to be made in order to perform this procedure? O A. Since the sample sizes are large enough, no assumptions are needed. O B. Although the sample size in the second sample is large enough, it must be assumed that the distribution for the first sample is normally distributed, and that the samples are independent. O C. It must be assumed that the distribution for both populations are normally distributed, and that the samples are independent. O D. Although the sample size in the first sample is large enough, it must be assumed that the distribution for the second population is normally distributed, and that the samples are independent


