Answered step by step
Verified Expert Solution
Link Copied!

Question

1 Approved Answer

The following table shows the expected return for each of the 3 stocks. It also shows the set risk level of 1.1% X ER 0.004078

image text in transcribed
The following table shows the expected return for each of the 3 stocks. It also shows the set risk level of 1.1% X ER 0.004078 0.00558 -0.00223 y Z Weights 0 0.4507 0.5492 1 ??? 0.00012 ERP Variance Portfolio Std. deviation Portfolio 0.011 QUESTION 3 (6 marks): 3a) Calculate the expected return of the portfolio (ERP) 3b) If this portfolio is optimal, then what can you conclude about its ERP? 3c) How is the ERP at a specific level of risk achieved in other words, what allows ERP at a specific level of risk to differ from the expected portfolio return at a different level of risk

Step by Step Solution

There are 3 Steps involved in it

Step: 1

blur-text-image

Get Instant Access to Expert-Tailored Solutions

See step-by-step solutions with expert insights and AI powered tools for academic success

Step: 2

blur-text-image

Step: 3

blur-text-image

Ace Your Homework with AI

Get the answers you need in no time with our AI-driven, step-by-step assistance

Get Started

Recommended Textbook for

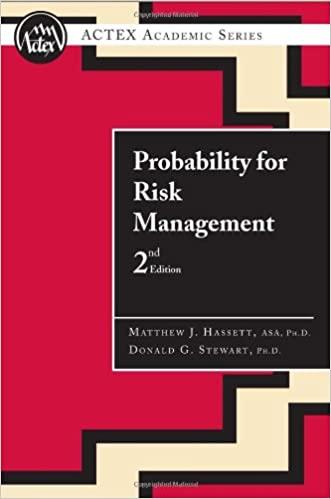
Probability For Risk Management

Authors: Matthew J. Hassett, Donald G. Stewart

2nd Edition

156698548X, 978-1566985482

More Books

Students also viewed these Finance questions