Question
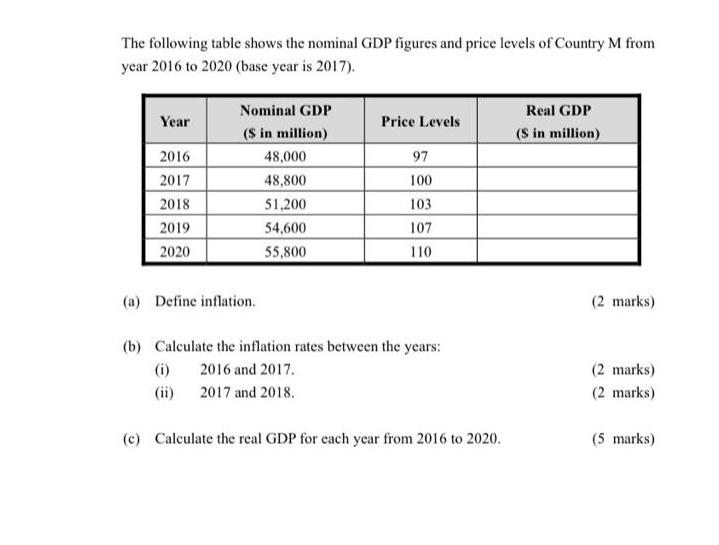
The following table shows the nominal GDP figures and price levels of Country M from year 2016 to 2020 (base year is 2017). Year

The following table shows the nominal GDP figures and price levels of Country M from year 2016 to 2020 (base year is 2017). Year 2016 2017 2018 2019 2020 Nominal GDP ($ in million) (a) Define inflation. (i) (ii) 48,000 48,800 51,200 54,600 55,800 Price Levels 97 100 103 107 110 (b) Calculate the inflation rates between the years: 2016 and 2017. 2017 and 2018. (c) Calculate the real GDP for each year from 2016 to 2020. Real GDP ($ in million) (2 marks) (2 marks) (2 marks) (5 marks)
Step by Step Solution
3.53 Rating (153 Votes )
There are 3 Steps involved in it
Step: 1
A Inflation is the rise in price level Rise in price level leads to fall in purchasing powe...
Get Instant Access to Expert-Tailored Solutions
See step-by-step solutions with expert insights and AI powered tools for academic success
Step: 2

Step: 3

Ace Your Homework with AI
Get the answers you need in no time with our AI-driven, step-by-step assistance
Get StartedRecommended Textbook for
Economics
Authors: Campbell R. McConnell, Stanley L. Brue, Sean M. Flynn
18th edition
978-0077413798, 0-07-336880-6, 77413792, 978-0-07-33688, 978-0073375694
Students also viewed these Finance questions
Question
Answered: 1 week ago
Question
Answered: 1 week ago
Question
Answered: 1 week ago
Question
Answered: 1 week ago
Question
Answered: 1 week ago
Question
Answered: 1 week ago
Question
Answered: 1 week ago
Question
Answered: 1 week ago
Question
Answered: 1 week ago
Question
Answered: 1 week ago
Question
Answered: 1 week ago
Question
Answered: 1 week ago
Question
Answered: 1 week ago
Question
Answered: 1 week ago
Question
Answered: 1 week ago
Question
Answered: 1 week ago
Question
Answered: 1 week ago
Question
Answered: 1 week ago
Question
Answered: 1 week ago
Question
Answered: 1 week ago
Question
Answered: 1 week ago
Question
Answered: 1 week ago
Question
Answered: 1 week ago
Question
Answered: 1 week ago
View Answer in SolutionInn App


