

Answered step by step
Verified Expert Solution
Question
1 Approved Answer
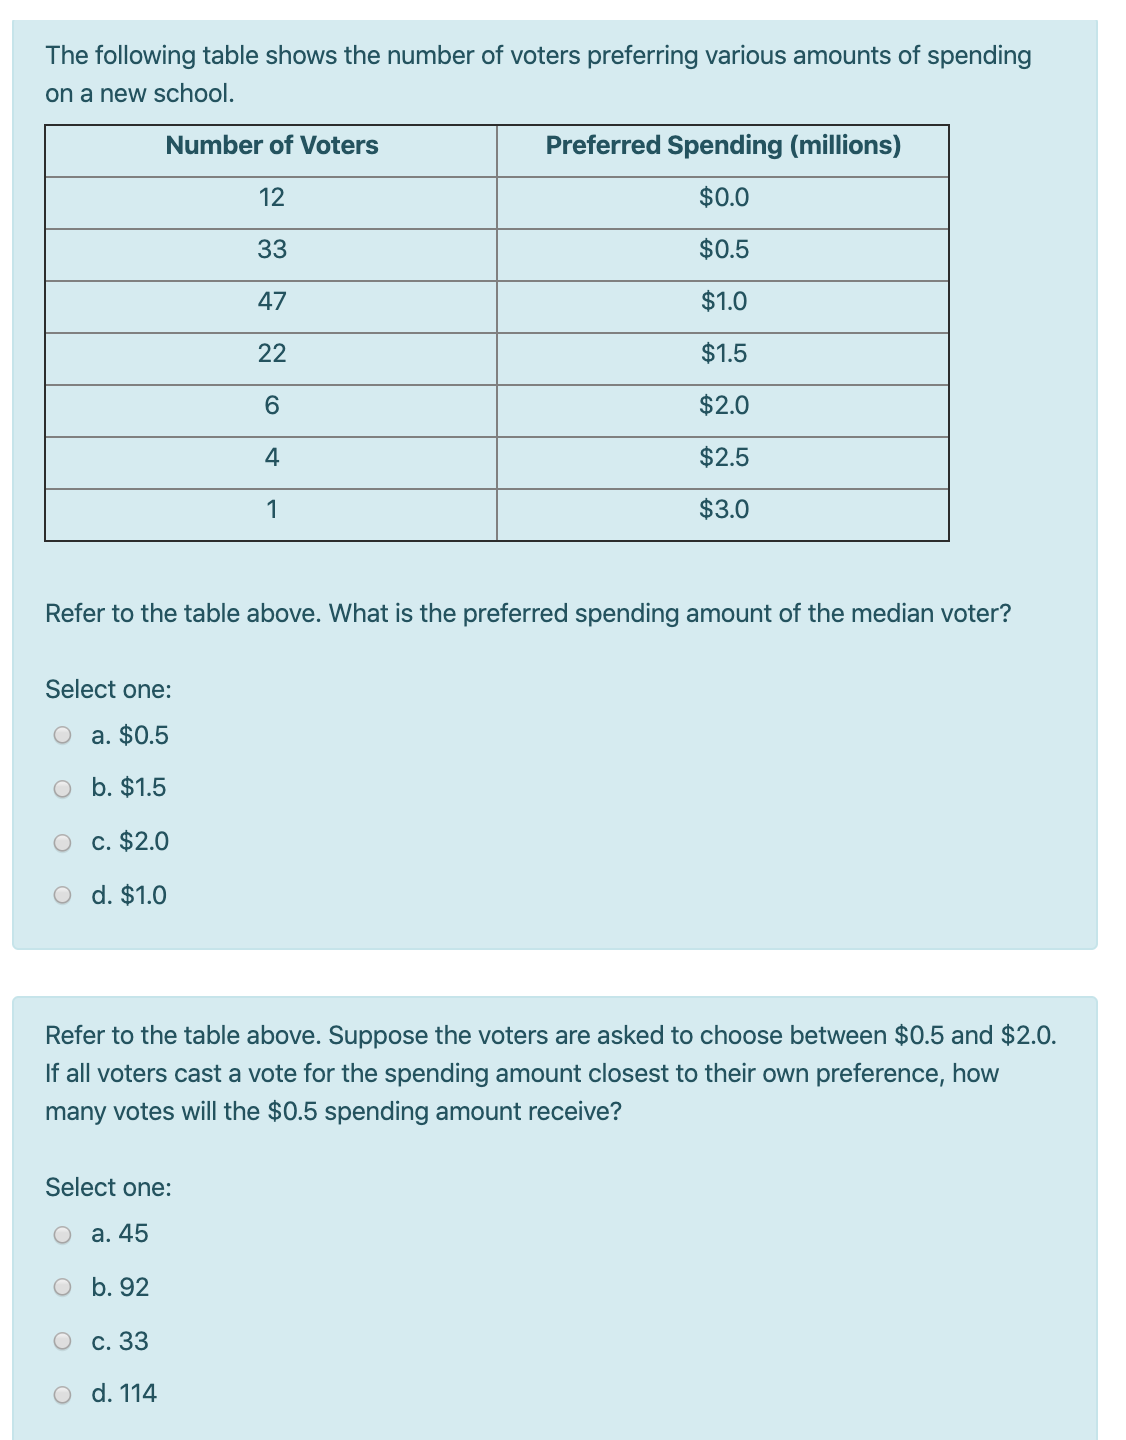
The following table shows the number of voters preferring various amounts of spending on a new school. Refer to the table above. What is the
Step by Step Solution
There are 3 Steps involved in it
Step: 1

Get Instant Access to Expert-Tailored Solutions
See step-by-step solutions with expert insights and AI powered tools for academic success
Step: 2

Step: 3
Ace Your Homework with AI
Get the answers you need in no time with our AI-driven, step-by-step assistance
Get Started
Advanced Placement Economics Microeconomics
Authors: Gary L. Stone
4th Edition
1561836699, 978-1561836697