

Answered step by step
Verified Expert Solution
Question
1 Approved Answer
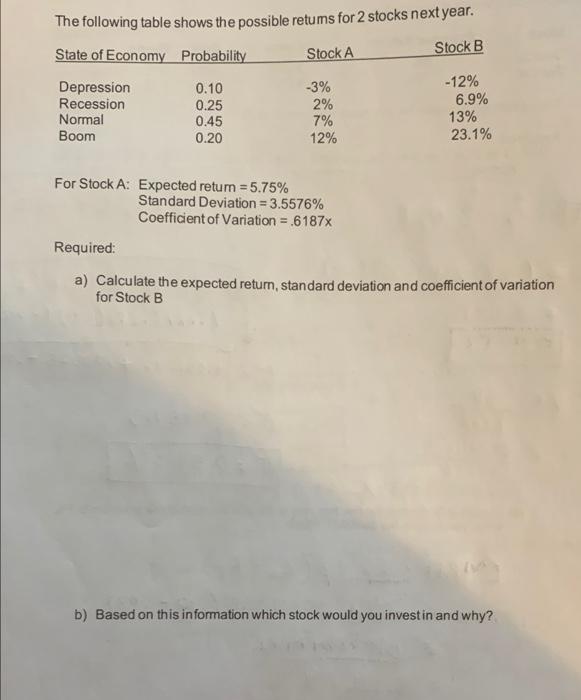
The following table shows the possible retums for 2 stocks next year. Stock A Stock B -3% State of Economy Probability Depression 0.10 Recession 0.25
Step by Step Solution
There are 3 Steps involved in it
Step: 1

Get Instant Access to Expert-Tailored Solutions
See step-by-step solutions with expert insights and AI powered tools for academic success
Step: 2

Step: 3
Ace Your Homework with AI
Get the answers you need in no time with our AI-driven, step-by-step assistance
Get Started
Personal Finance
Authors: E. Thomas Garman, Raymond E. Forgue, Jonathan Fox
14th Edition
0357901495, 9780357901496