Answered step by step
Verified Expert Solution
Link Copied!

Question

1 Approved Answer

The following table shows the yearly returns for the market portfolio Time running Atmode: 17 Junat 1 Hour 17 minute Year Return 2019 10% 2018

image text in transcribed
The following table shows the yearly returns for the market portfolio Time running Atmode: 17 Junat 1 Hour 17 minute Year Return 2019 10% 2018 -2% 2017 -0.25% 2016 21.25% 2015 5.28% 2014 0.58% 2013 4.89% 1) What is the average return in % over the sample period? 2) What is the standard deviation in % over the sample period? 3) If risk-free rate is 2% during the sample period, what is the reward for risk ratio

Step by Step Solution

There are 3 Steps involved in it

Step: 1

blur-text-image

Get Instant Access to Expert-Tailored Solutions

See step-by-step solutions with expert insights and AI powered tools for academic success

Step: 2

blur-text-image

Step: 3

blur-text-image

Ace Your Homework with AI

Get the answers you need in no time with our AI-driven, step-by-step assistance

Get Started

Recommended Textbook for

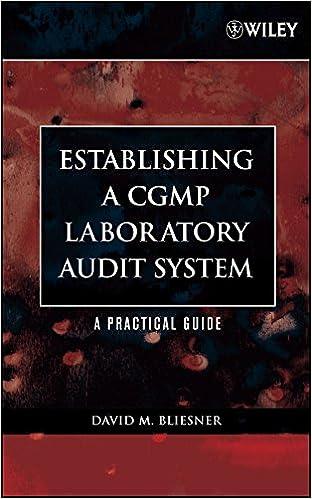
Establishing A CGMP Laboratory Audit System A Practical Guide

Authors: David M. Bliesner

1st Edition

0471738409, 978-0471738404

More Books

Students also viewed these Accounting questions

Question

6. How is revising different from proofreading?

Answered: 1 week ago