

Answered step by step
Verified Expert Solution
Question
1 Approved Answer
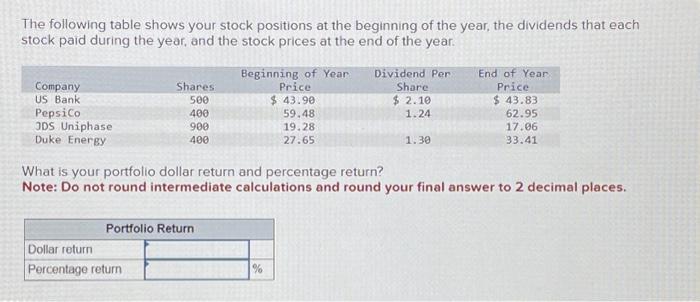
The following table shows your stock positions at the beginning of the year, the dividends that each stock paid during the year, and the stock
The following table shows your stock positions at the beginning of the year, the dividends that each stock paid during the year, and the stock prices at the end of the year. Company US Bank PepsiCo JDS Uniphase Duke Energy Shares 500 400 900 400 Portfolio Return Dollar return Percentage return Beginning of Year Price $ 43.90 59.48 19.28 27.65 % Dividend Per Share $ 2.10 1.24 1.30 What is your portfolio dollar return and percentage return? Note: Do not round intermediate calculations and round your final answer to 2 decimal places. End of Year Price $ 43.83 62.95 17.06 33.41
Step by Step Solution
There are 3 Steps involved in it
Step: 1

Get Instant Access to Expert-Tailored Solutions
See step-by-step solutions with expert insights and AI powered tools for academic success
Step: 2

Step: 3
Ace Your Homework with AI
Get the answers you need in no time with our AI-driven, step-by-step assistance
Get Started
Fundamentals Of Financial Management
Authors: James C. Van Horne
10th Edition
0138596875, 978-0138596873