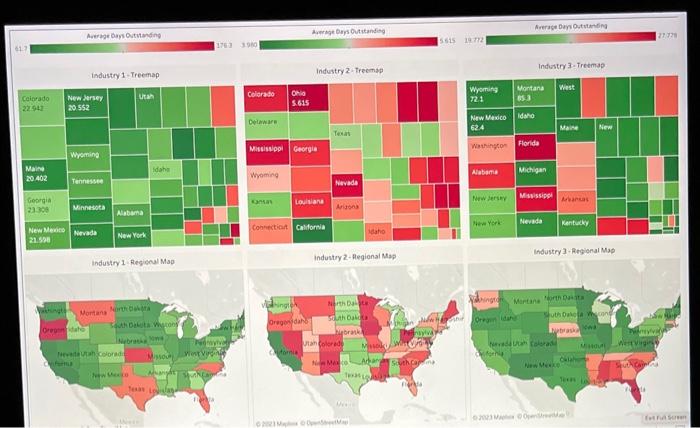
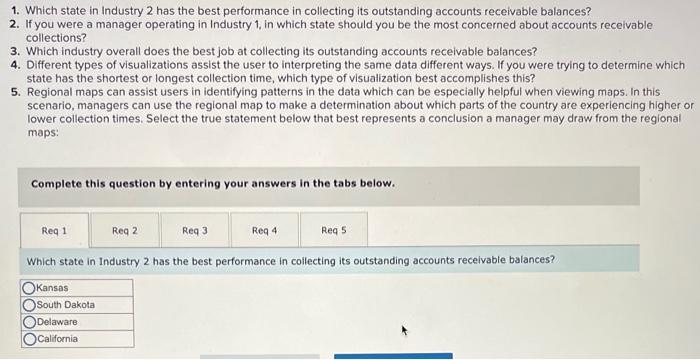
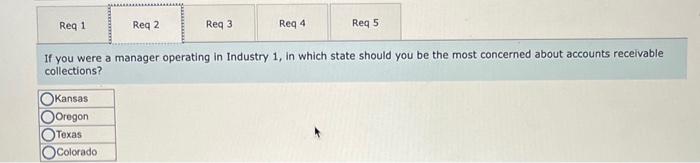
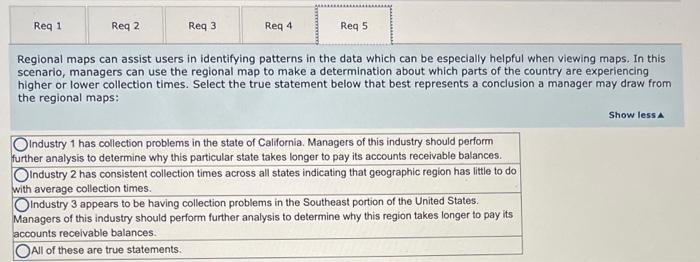
The following Tableau Dashboard shows two different types of visualizations for each of three different industries: a treemap and a regional map. Different types of visualizations can assist users in making different determinations from the same data. The data displayed in these visualizations represent the average days to collect an accounts receivable balance for each industry, organized by state. Due to the large amount of data displayed, you may need to rely on the information presented in the tooltips, which can be accessed by hovering over data fields within the visualizations. To assist in interpreting the data, high collections times are shaded red while shorter collection times are shaded green. The size of each box in the treemap visualization represents the dollar value of each states accounts receivable balance, where larger (smaller) industry 1 Aegignal Map. industery 2 - Megional Map Industry 3 - Regignal Map 1. Which state in Industry 2 has the best performance in collecting its outstanding accounts receivable balances? 2. If you were a manager operating in Industry 1 , in which state should you be the most concerned about accounts receivable collections? 3. Which industry overall does the best job at collecting its outstanding accounts receivable balances? 4. Different types of visualizations assist the user to interpreting the same data different ways. If you were trying to determine which state has the shortest or longest collection time, which type of visualization best accomplishes this? 5. Regional maps can assist users in identifying patterns in the data which can be especially helpful when viewing maps. In this scenario, managers can use the regional map to make a determination about which parts of the country are experiencing higher or lower collection times. Select the true statement below that best represents a conclusion a manager may draw from the regional maps: Complete this question by entering your answers in the tabs below. Which state in Industry 2 has the best performance in collecting its outstanding accounts recelvable balances? If you were a manager operating in Industry 1 , in which state should you be the most concerned about accounts receivable collections? Complete this question by entering your answers in the tabs below. Which industry overall does the best job at collecting its outstanding accounts recelvable balances? Different types of visualizations assist the user to interpreting the same data different ways. If you were trying to de which state has the shortest or longest collection time, which type of visualization best accomplishes this? Regional maps can assist users in identifying patterns in the data which can be especially helpful when viewing maps. In this scenario, managers can use the regional map to make a determination about which parts of the country are experiencing higher or lower collection times. Select the true statement below that best represents a conclusion a manager may draw from the regional maps: Show less a Industry 1 has collection problems in the state of California. Managers of this industry should perform further analysis to determine why this particular state takes longer to pay its accounts receivable balances. Industry 2 has consistent collection times across all states indicating that geographic region has little to do with average collection times. Industry 3 appears to be having collection problems in the Southeast portion of the United States. Managers of this industry should perform further analysis to determine why this region takes longer to pay its accounts recelvable balances. All of these are true statements