Answered step by step
Verified Expert Solution
Question
1 Approved Answer
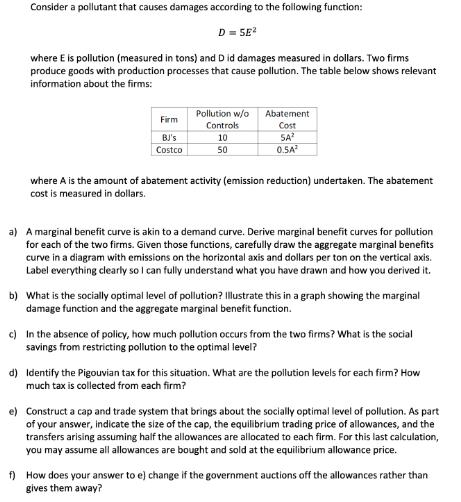
Consider a pollutant that causes damages according to the following function: D=5E where E is pollution (measured in tons) and D id damages measured

Consider a pollutant that causes damages according to the following function: D=5E where E is pollution (measured in tons) and D id damages measured in dollars. Two firms produce goods with production processes that cause pollution. The table below shows relevant information about the firms: Firm Pollution w/o Controls Abatement Cost BJ's 10 5A2 Costco 50 0.5A where A is the amount of abatement activity (emission reduction) undertaken. The abatement cost is measured in dollars. a) A marginal benefit curve is akin to a demand curve. Derive marginal benefit curves for pollution for each of the two firms. Given those functions, carefully draw the aggregate marginal benefits curve in a diagram with emissions on the horizontal axis and dollars per ton on the vertical axis. Label everything clearly so I can fully understand what you have drawn and how you derived it. b) What is the socially optimal level of pollution? Illustrate this in a graph showing the marginal damage function and the aggregate marginal benefit function. c) In the absence of policy, how much pollution occurs from the two firms? What is the social savings from restricting pollution to the optimal level? d) Identify the Pigouvian tax for this situation. What are the pollution levels for each firm? How much tax is collected from each firm? e) Construct a cap and trade system that brings about the socially optimal level of pollution. As part of your answer, indicate the size of the cap, the equilibrium trading price of allowances, and the transfers arising assuming half the allowances are allocated to each firm. For this last calculation, you may assume all allowances are bought and sold at the equilibrium allowance price. f) How does your answer to e) change if the government auctions off the allowances rather than gives them away?
Step by Step Solution
There are 3 Steps involved in it
Step: 1
Lets tackle each part step by step a To derive the marginal benefit curve for pollution for each fir...
Get Instant Access to Expert-Tailored Solutions
See step-by-step solutions with expert insights and AI powered tools for academic success
Step: 2

Step: 3

Ace Your Homework with AI
Get the answers you need in no time with our AI-driven, step-by-step assistance
Get Started


