Answered step by step
Verified Expert Solution
Question
1 Approved Answer
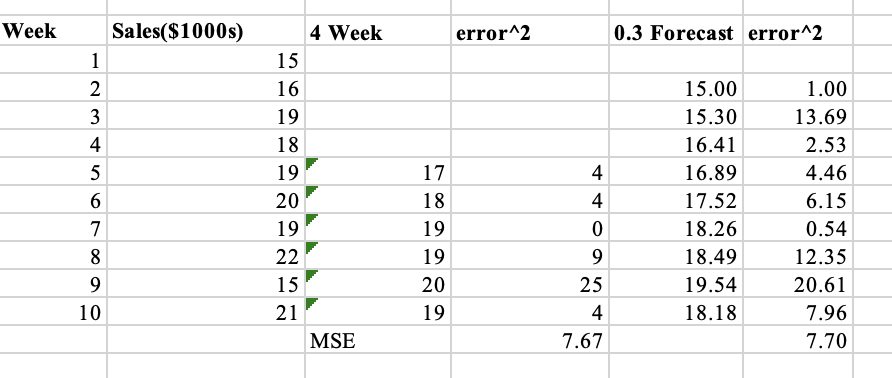
The following time series shows the sales of a clothing store over a 10-week period Week Sales($1000s) 4 Week error^2 0.3 Forecast error^2 15 16
The following time series shows the sales of a clothing store over a 10-week period

Step by Step Solution
There are 3 Steps involved in it
Step: 1

Get Instant Access to Expert-Tailored Solutions
See step-by-step solutions with expert insights and AI powered tools for academic success
Step: 2

Step: 3

Ace Your Homework with AI
Get the answers you need in no time with our AI-driven, step-by-step assistance
Get Started


