Answered step by step
Verified Expert Solution
Question
1 Approved Answer
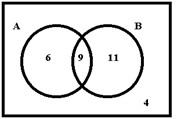
The following Venn diagram shows the data obtained in a survey of people, where they were asked whether they drank tea, coffee or chocolate. The
The following Venn diagram shows the data obtained in a survey of people, where they were asked whether they drank tea, coffee or chocolate. The numbers shown refer to the number of people who answered the question in the various possible ways: all three beverages, only tea, tea and chocolate but no coffee, etc.

Step by Step Solution
There are 3 Steps involved in it
Step: 1

Get Instant Access to Expert-Tailored Solutions
See step-by-step solutions with expert insights and AI powered tools for academic success
Step: 2

Step: 3

Ace Your Homework with AI
Get the answers you need in no time with our AI-driven, step-by-step assistance
Get Started


