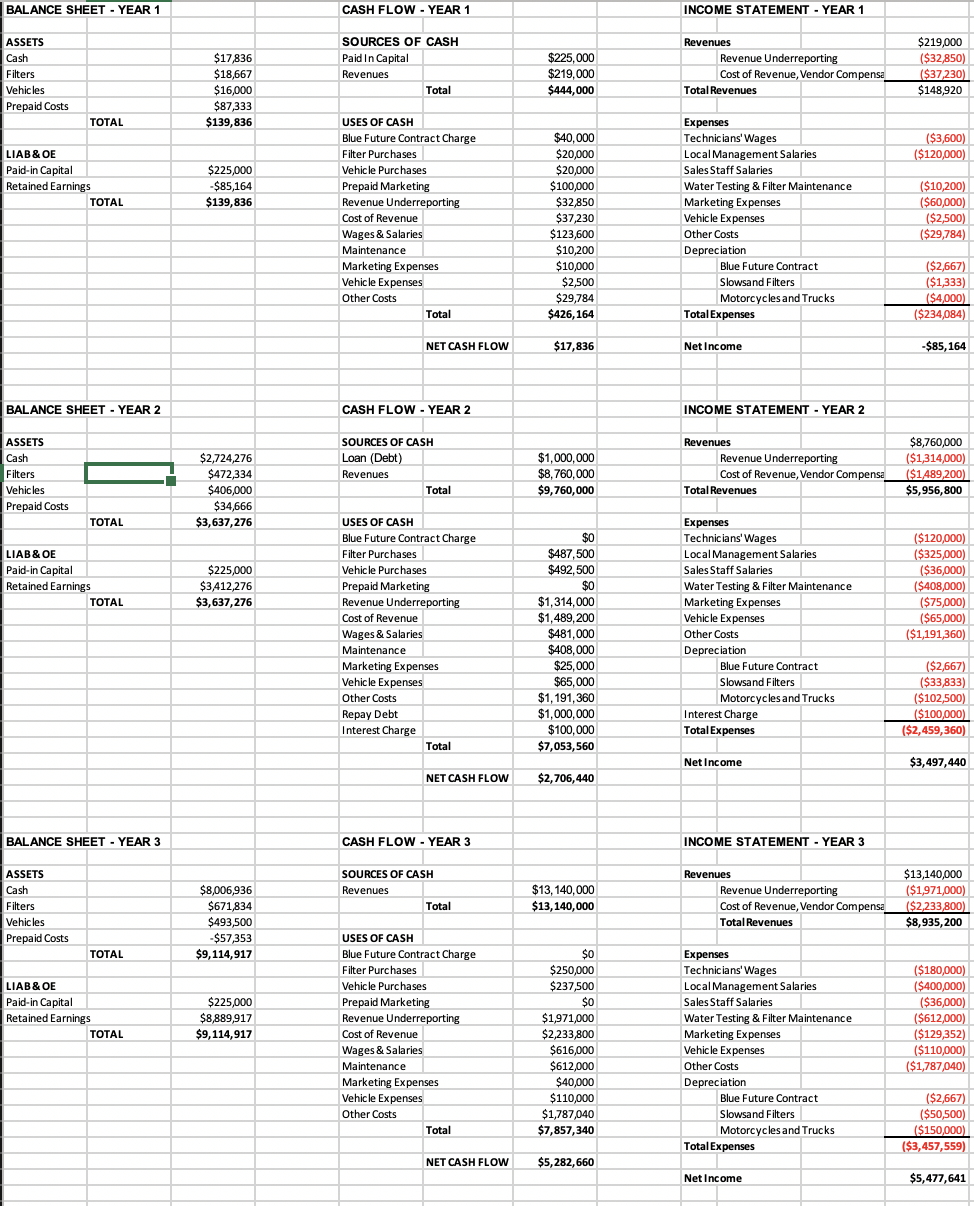
The following worksheet is called a Balance Sheet Equation Worksheet. The worksheet lists the key events in the life of UWP over years 1 through 3: each of these events is likely to affect the financial statements of UWP. The impact of the events on the UWP Balance Sheet for years 1 and 2 has been sketched out.
Do you agree with all of the accounting assumptions in the worksheet? If not, what would you change?

BALANCE SHEET - YEAR 1 CASH FLOW - YEAR 1 INCOME STATEMENT - YEAR 1 ASSETS Cash Filters Vehicles Prepaid Costs $17,836 $18,667 $16,000 $87,333 $139,836 SOURCES OF CASH Paid in Capital Revenues Total $225,000 $219,000 $444,000 Revenues Revenue Underreporting Cost of Revenue, Vendor Compensa Total Revenues $219,000 ($32,850) ($37,230) $148,920 TOTAL ($3,600) ($120,000) LIAB & OE Paid-in Capital Retained Earnings TOTAL $225,000 -$85,164 $139,836 USES OF CASH Blue Future Contract Charge Cat Filter Purchases Vehicle Purchases Prepaid Marketing Revenue Underreporting Cost of Revenue $40,000 $20,000 $20,000 $100,000 $32,850 22 $37,230 can $123,600 $10,200 con $10,000 $2,500 Expenses Technicians' Wages Local Management Salaries Sales Staff Salaries Water Testing & Filter Maintenance Marketing Expenses Vehicle Expenses Costa Depreciation Blue Future Contract Slowsand Filters Motorcycles and Trucks Total Expenses ($10,200) ($60,000) ($2,500) ($29,784) Wages & Salaries Other Costs Maintenance Marketing Expenses Vehicle Expenses Other Costs Total $29,784 $426,164 ($2,667) ($1,333) ($4,000) ($234,084) NET CASH FLOW $17,836 Net Income -$85,164 BALANCE SHEET - YEAR 2 CASH FLOW - YEAR 2 INCOME STATEMENT - YEAR 2 ASSETS Cash Filters Vehicles Prepaid Costs $2,724,276 $472,334 $406,000 $34,666 $3,637,276 SOURCES OF CASH Loan (Debt) Revenues Total $1,000,000 $8,760,000 $9,760,000 Revenues Revenue Underreporting Cost of Revenue, Vendor Compensa Total Revenues $8,760,000 ($1,314,000) ($1,489,200) $5,956,800 TOTAL Expenses LIAB & OE Paid-in Capital Retained Earnings TOTAL $225,000 $3,412,276 $3,637,276 USES OF CASH Blue Future Contract Charge Filter Purchases Vehicle Purchases Prepaid Marketing Revenue Underreporting Cost of Revenue Wages & Salaries Maintenance Marketing Expenses Vehicle Expenses Other Costs Repay Debt Interest Charge Total $0 $487,500 $492,500 $0 $1,314,000 $1,489,200 "700 $481,000 $408.000 $25,000 $65,000 $1,191,360 $ $1,000,000 $100,000 $7,053,560 $ Technicians' Wages Local Management Salaries Sales Staff Salaries Water Testing & Filter Maintenance Marketing Expenses Vehicle Expenses Other Costs Depreciation Blue Future Contract Slowsand Filters Motorcycles and Trucks Interest Charge Total Expenses ($120,000) ($325,000) ($36,000) ($408,000) ($75,000) 103000) ($65,000) ($1,191,360) ($2,667) ($33,833) ($102,500) ($100,000) ($2,459,360) Net Income $3,497,440 NET CASH FLOW $2,706,440 BALANCE SHEET - YEAR 3 CASH FLOW - YEAR 3 INCOME STATEMENT - YEAR 3 ASSETS Cash Filters Vehicles Prepaid Costs SOURCES OF CASH Revenues Total $13, 140,000 $13,140,000 $8,006,936 $671834 $493,500 -$57,353 $9,114,917 Revenues Revenue Underreporting Cost of Revenue, Vendor Compensa Total Revenues $13,140,000 ($1,971,000) ($2,233 800) $8,935, 200 TOTAL $237,500 LIAB & OE Paid-in Capital Retained Earnings TOTAL $225,000 $8,889,917 $9,114,917 USES OF CASH Blue Future Contract Charge Filter Purchases Vehicle Purchases Prepaid Marketing Revenue Underreporting Cost of Revenue Wages & Salaries Maintenance Marketing Expenses Vehicle Expenses Other Costs Total $0 $250,000 7500 co $0 $1,971,000 2100 $2,233,800 $616,000 $612,000 $40,000 1000 $110,000 Expenses Technicians' Wages Local Management Salaries Sales Staff Salaries Water Testing & Filter Maintenance Marketing Expenses Vehicle Expenses Other Costs istio Depreciation Blue Future Contract Slowsand Filters Motorcycles and Trucks Total Expenses ($180,000) ($400,000) ($36,000) ($612,000) ($129,352) ($110,000) ($1,787,040) $1,787,040 ($2,667) ($50,500) ($150,000) ($3,457,559) $7,857,340 NET CASH FLOW $5,282,660 Net Income $5,477,641


