

Question
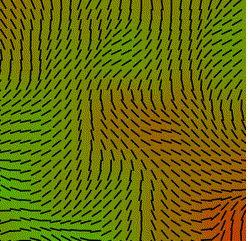
The goal is to complete a constantly evolving generative piece - I am attaching image, which shows movement of color and compass lines, depending on
The goal is to complete a constantly evolving generative piece - I am attaching image, which shows movement of color and compass lines, depending on x coordinate of moue
JavaScript, p5,js libraries (p5.min.js, p5,sound.min.js) noisyGrid, VS code, extension brackets
Below are the steps that requires completion and which is code that requires completion.
Question: please add code required to code pieces I am adding below.
Steps to complete
1. Creating a colorful grid
Step 2: the grid of tiles should continuously, slowly change colors - please assist. lerpColo() function needs be used
Step 3: Make the grid color change speed be dependent on the x coordinate of the mouse (ie small mouseX, faster color changes) - please assist: it is not working
2. Compass Grid
Step 5: For each of the compasses generate a 3D noise value, using the compass x and y coordinate as well as the frameCount so that the noise values change over time. Make sure you scale the input parameters of the noise function appropriately so that you get organic values out of it. Use that noise value with map() to generate an angle between 0 and 720 degrees. Use that value to rotate the compass. If youve done things right your compasses should be rotating while the sketch is running: Please assist with revised as compasses are not rotating.
If your lines are not rotating in the pattern seen above check how you are scaling the input parameters of noise(). Also study how each line rotates in the gif above.
Step 6: Make the compass movement speed be dependent on the x coordinate of the mouse (ie small mouseX, faster compass rotations): Please assist with revised code
Step 7:
- Change the colors and style: Please assist with code
- Use the noise to change the color and length of the compass lines: Please assist with code
Thank you - I am a starter learner and need a lot of assistance with the actual code required
--------------------------------------------
sketch.js
>>>>>>>
var stepSize = 20; // variable is used to determine the size of the rectangles and compasses in grid
// function is called once when sketch is starts. canvas with width 500 pixels and height 500 pixels
function setup() {
createCanvas(500, 500);
}
///////////////////////////////////////////////////////////////////////
// function is called repeatedly by p5.js, at rate determined by the frame rate
// call colorGrid and compassGrid functions to draw the grid
function draw() {
background(125); // background color is light gray
colorGrid();
compassGrid();
}
///////////////////////////////////////////////////////////////////////
function colorGrid(){
// your code here
// creates 25 x 25 grid of rectangles
for (let y = 0; y
for (let x = 0; x
fill(255); // Set the fill to white
stroke(0); // Set the stroke to black
rect(x, y, stepSize, stepSize); // Draw the rectangle
}
}
// For each rectangle, generate a 3D noise value using the tile's x and y coordinates and the frameCount
for (let y = 0; y
for (let x = 0; x
let noiseVal = noise(x / 50, y / 50, frameCount / 50); // Scale the input parameters of the noise function appropriately
let interpColor = lerpColor(color(255, 0, 0), color(0, 255, 0), noiseVal); // Use lerpColor() to interpolate between red and green
fill(interpColor); // Use the interpolated color to fill the rectangle
noStroke(); // Remove the stroke
rect(x, y, stepSize, stepSize); // Draw the rectangle
}
}
// Make the grid color change speed dependent on the x coordinate of the mouse
var speed = map(mouseX, 0, width, 0, 5); // Map the mouseX value to a speed value between 0 and 5
frameRate(30 + speed); // Set the frame rate to 30 plus the speed value
}
///////////////////////////////////////////////////////////////////////
function compassGrid(){
// your code here
// creates a 25x25 grid of compasses
for (let y = 0; y
for (let x = 0; x
push(); // Save the current transformation matrix
translate(x + stepSize / 2, y + stepSize / 2); // Move to the center of each grid
stroke(0); // Set the stroke color to black
line(0, 0, 0, -stepSize / 2); // Draw the line of the compass
pop(); // Restore the previous transformation matrix
}
}
// For each compass, generate a 3D noise value using the compass' x and y coordinates and the frameCount
for (let y = 0; y
for (let x = 0; x
push(); // Save the current transformation matrix
translate(x + stepSize / 2, y + stepSize / 2); // Move to the center of each grid
let noiseVal = noise(x / 100, y / 100, frameCount / 10); // Scale the input parameters of the noise function appropriately
let angle = map(noiseVal, 0, 1, 0, 720); // Use map() to generate an angle between 0 and 720 degrees
rotate(radians(angle)); // Rotate the compass by the angle
}
}
}
--------------------------------------------------------
index.html
>>>>>>>>>>
Step by Step Solution
There are 3 Steps involved in it
Step: 1

Get Instant Access to Expert-Tailored Solutions
See step-by-step solutions with expert insights and AI powered tools for academic success
Step: 2

Step: 3
Ace Your Homework with AI
Get the answers you need in no time with our AI-driven, step-by-step assistance
Get Started
Oracle Database 12c Dba Handbook Manage A Scalable Secure Oracle Enterprise Database Environment
Authors: Bob Bryla
1st Edition
0071798781, 978-0071798785