Question
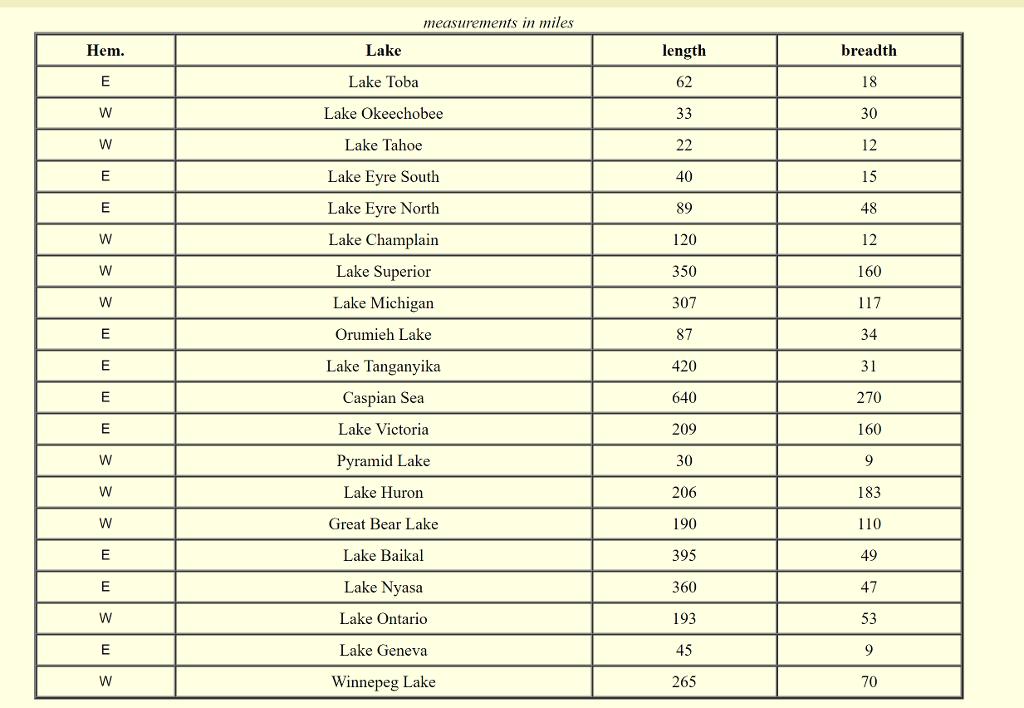
The golden ratio f = 1.618 is thought to be a natural relationship between length and breadth. At a = 0.05 , use TABLE 1
The golden ratio f = 1.618 is thought to be a “natural” relationship between length and breadth. At a = 0.05, use TABLE 1 to test the hypothesis that the ratio of length to breadth for these sample lakes is 1.618
Similarly, test the hypotheses that the ratio is bigger than 2.26
Correlate “length” versus “breadth.” Compute the line of regression. Graph it
Divide the lakes into Western and Eastern hemispheres. Test the hypothesis that their ratios have the same sample means. Discuss the viability of that hypothesis, in light of your analysis
Global warming is creating a new Great Lake. Suppose the length is 300 miles. Give a 90% confidence interval for the breadth of this new lake Use the approach given in Chapter 8 of the text, with a t statistic
NOTE: RELY ON THE TABLE OF RATIOS — DO PROJECT BREADTH BASED ON THOSE RATIOS
Test the independence of the “length” and “breadth” variables using a chi-square test with a = 0.05 USE TABLE TO FIND CHI-SQUARE ANOVA concern

measurements in miles Hem. Lake length breadth E Lake Toba 62 18 Lake Okeechobee 33 30 Lake Tahoe 22 12 Lake Eyre South 40 15 Lake Eyre North 89 48 W Lake Champlain 120 12 Lake Superior 350 160 W Lake Michigan 307 117 Orumieh Lake 87 34 E Lake Tanganyika 420 31 Caspian Sea 640 270 E Lake Victoria 209 160 Pyramid Lake 30 9 W Lake Huron 206 183 W Great Bear Lake 190 110 E Lake Baikal 395 49 E Lake Nyasa 360 47 Lake Ontario 193 53 E Lake Geneva 45 9 Winnepeg Lake 265 70
Step by Step Solution
3.39 Rating (165 Votes )
There are 3 Steps involved in it
Step: 1
Sedter plot g ...
Get Instant Access to Expert-Tailored Solutions
See step-by-step solutions with expert insights and AI powered tools for academic success
Step: 2

Step: 3

Ace Your Homework with AI
Get the answers you need in no time with our AI-driven, step-by-step assistance
Get Started


