

Answered step by step
Verified Expert Solution
Question
1 Approved Answer
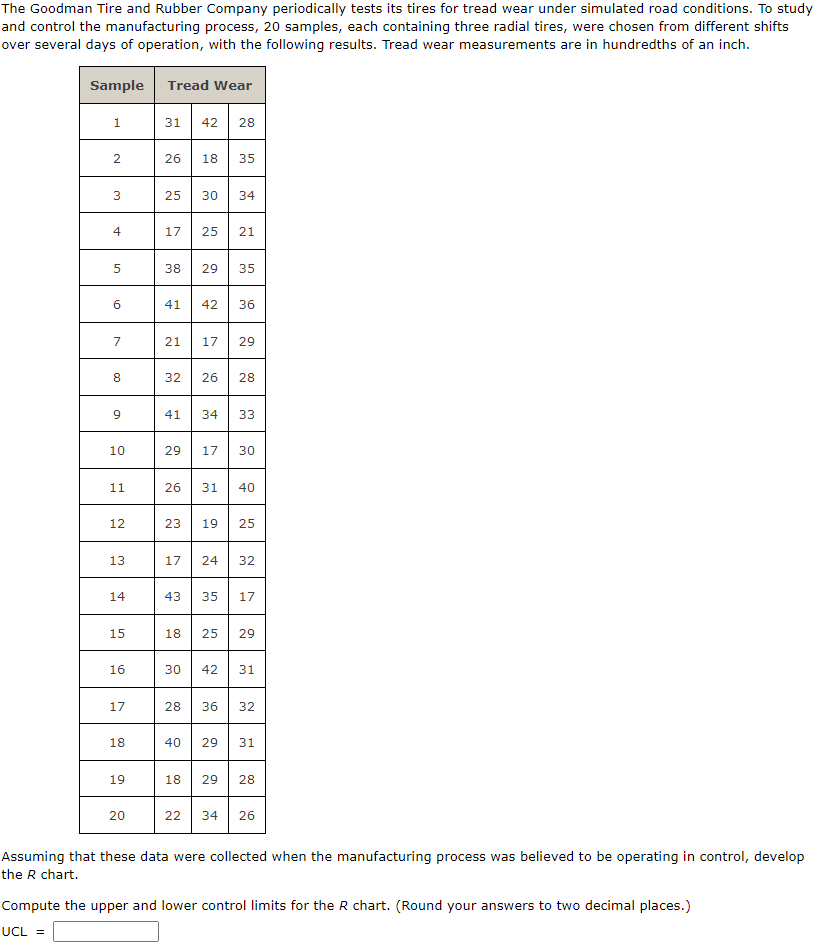
The Goodman Tire and Rubber Company periodically tests its tires for tread wear under simulated road conditions. To study and control the manufacturing process, 20
Step by Step Solution
There are 3 Steps involved in it
Step: 1

Get Instant Access to Expert-Tailored Solutions
See step-by-step solutions with expert insights and AI powered tools for academic success
Step: 2

Step: 3
Ace Your Homework with AI
Get the answers you need in no time with our AI-driven, step-by-step assistance
Get Started
Will You Be My Internal Audit Manager
Authors: Benito Gross
1st Edition
B09774C8CK, 979-8521636563