

Answered step by step
Verified Expert Solution
Question
1 Approved Answer
The Grace of Dr. Mrs. Mojisola Olayinka Edema: A Visionary and a Reformer For the graphical presentations (known as line graphs/frequency polygons) on The Mathematics
- The Grace of Dr. Mrs. Mojisola Olayinka Edema: A Visionary and a Reformer
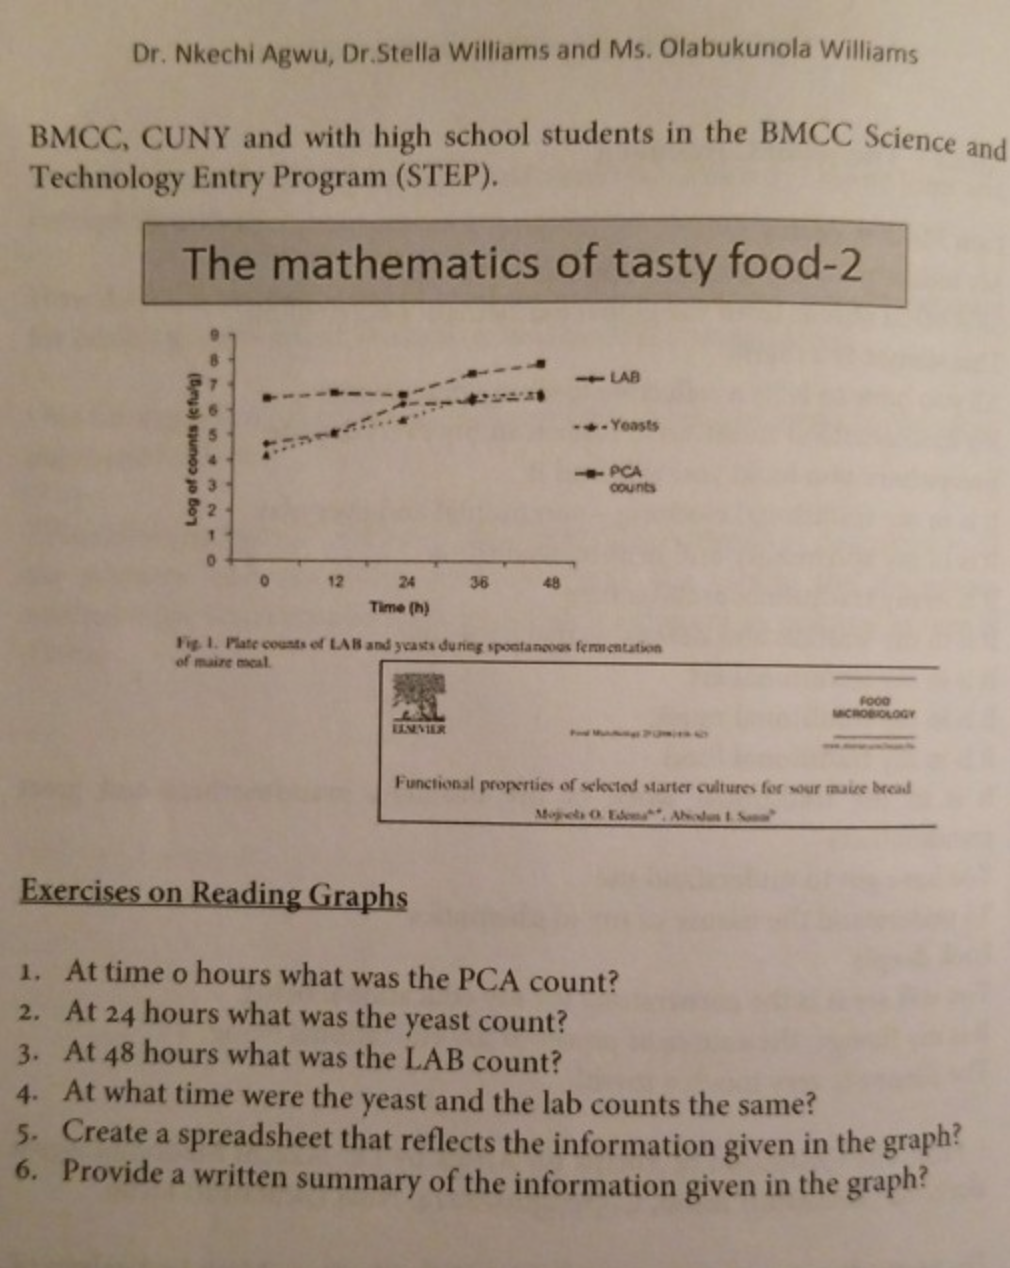
- For the graphical presentations (known as line graphs/frequency polygons) on The Mathematics of Tasty Food 2 in chapter seven, answers the six exercises on reading graphs given in the book and also below. Kindly show your work. A line graph/frequency polygon is a graph that is used to show trends in data, where things are increasing, decreasing and steady.
- At time 0 hours what was the PCA count?
- At time 24 hours what was the Yeast count?
- At time 48 hours what was the LAB count?
- At what time were the Yeast and LAB counts the same?
- Generate a spreadsheet that reflects the information given in the graph?
- Provide a written summary of the information in the graph? Your summary should discuss trends showing that you understand the reasons for using a line graph/frequency polygon to graph the data.
Step by Step Solution
There are 3 Steps involved in it
Step: 1

Get Instant Access to Expert-Tailored Solutions
See step-by-step solutions with expert insights and AI powered tools for academic success
Step: 2

Step: 3
Ace Your Homework with AI
Get the answers you need in no time with our AI-driven, step-by-step assistance
Get Started
Applied Calculus
Authors: Stefan Waner, Steven Costenoble
6th Edition
1285415310, 9781285415314