Answered step by step
Verified Expert Solution
Question
1 Approved Answer
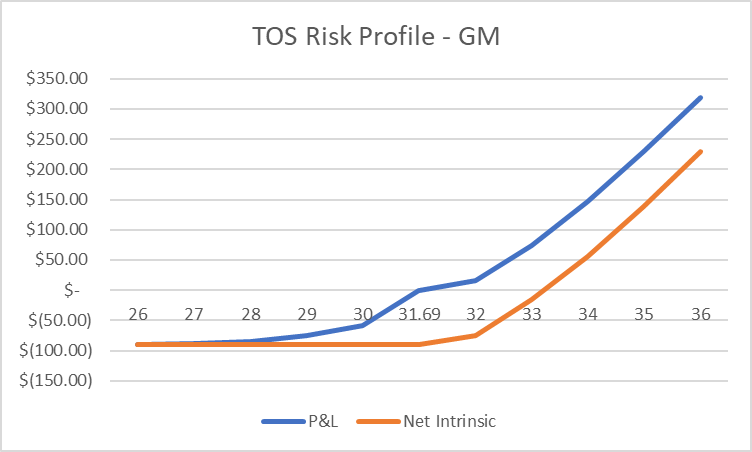
The graph above is the one from question #5 that they want refered to Consider the theoretical value line that you created in Q#5 above.

The graph above is the one from question #5 that they want refered to
- Consider the theoretical value line that you created in Q#5 above. Using that as a supporting graphic tool, explain the concepts of and . What are they, how do they behave across the different values of S0 at any point in time, and how do they behave relative to the property of convergence?
2. Once again using the theoretical value line from Q#5, explain the concepts of and vega. How do they behave across different values of S0 at any point in time? How does the value of behave over time?
TOS Risk Profile - GM $350.00$300.00$250.00$200.00$150.00$100.00$50.00$$(50.00)$(100.00)$(150.00) P\& Net IntrinsicStep by Step Solution
There are 3 Steps involved in it
Step: 1

Get Instant Access to Expert-Tailored Solutions
See step-by-step solutions with expert insights and AI powered tools for academic success
Step: 2

Step: 3

Ace Your Homework with AI
Get the answers you need in no time with our AI-driven, step-by-step assistance
Get Started


