

Answered step by step
Verified Expert Solution
Question
1 Approved Answer
The graph below depicts the market for smartphones. You will use this graph to analyze the effect of a price ceiling in this market.
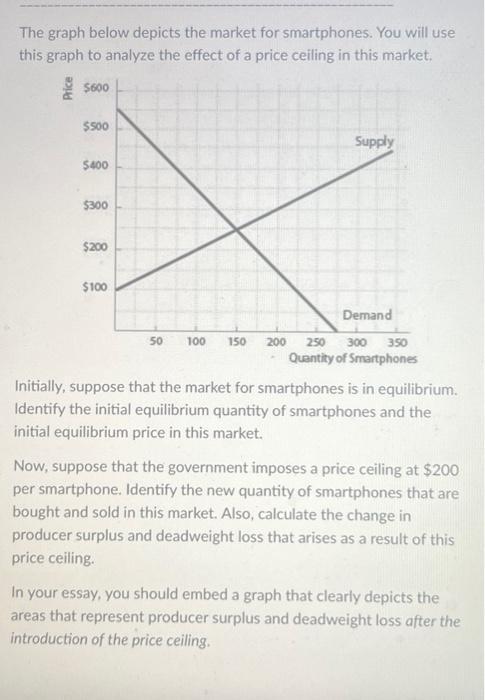
The graph below depicts the market for smartphones. You will use this graph to analyze the effect of a price ceiling in this market. $600 $500 $400 $300 $200 $100 50 100 150 200 Supply Demand 250 300 350 Quantity of Smartphones Initially, suppose that the market for smartphones is in equilibrium. Identify the initial equilibrium quantity of smartphones and the initial equilibrium price in this market. Now, suppose that the government imposes a price ceiling at $200 per smartphone. Identify the new quantity of smartphones that are bought and sold in this market. Also, calculate the change in producer surplus and deadweight loss that arises as a result of this price ceiling. In your essay, you should embed a graph that clearly depicts the areas that represent producer surplus and deadweight loss after the introduction of the price ceiling.
Step by Step Solution
★★★★★
3.38 Rating (154 Votes )
There are 3 Steps involved in it
Step: 1

Get Instant Access to Expert-Tailored Solutions
See step-by-step solutions with expert insights and AI powered tools for academic success
Step: 2

Step: 3
Ace Your Homework with AI
Get the answers you need in no time with our AI-driven, step-by-step assistance
Get Started
Principles of Economics
Authors: Fred M. Gottheil
7th edition
978-1133962069, 9781285064444, 1133962068, 1285064445, 978-1285064437