Question
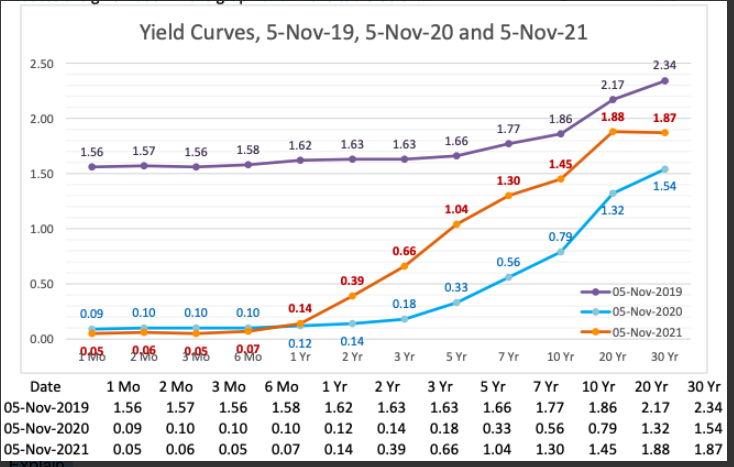
The graph below depicts the yield curves for November 5, 2021 (today), November 5, 2020 (one year ago), and November 5, 2019 (two years ago).
The graph below depicts the yield curves for November 5, 2021 (today), November 5, 2020 (one year ago), and November 5, 2019 (two years ago). The yield rates for each of those dates are given both in the graph and in the table below

a) Two years ago, on November 5, 2019, the policy rate (federal funds rate target) stood at 1.50-1.75%. In March 2020, the Federal Reserve cut its policy rate, first by 50 basis points (bps) on March 4 and then by 100 bps on March 16, to 0-0.25%, where it remains. Did market participants two years ago (on November 5, 2019) see those cuts coming? Why or why not? Explain.
b)As of today, what is the one-month interest rate expected by financial market participants for January 5, 2022? Does it appear that financial market participants are currently expecting changes in monetary policy within the next two months? Why or why not? Explain.
c) As of today, what is the one-year interest rate expected by financial market participants for November 5, 2023? Does it appear that financial market participants are currently expecting changes in monetary policy within the next two years? Why or why not? Explain.
Today (11/5/2021), the yield on a one-year Colombian government bond is 3.24%, and the Colombian exchange rate is 3,872.50 COP/USD (i.e., 3,872.5 Colombian pesos per US dollar).
d) If the uncovered interest parity condition holds, do financial market participants expect the Colombian peso to appreciate or depreciate (vis--vis the US dollar) over the next year? What exchange rate are financial market participants expecting for November 5, 2022? Explain the intuition for this.
Yield Curves, 5-Nov-19, 5-Nov-20 and 5-Nov-21 2.50 2.34 2.17 2.00 1.86 1.88 1.87 1.77 1.63 1.56 1.62 1.66 1.63 1.57 1.58 1.56 1.45 1.50 1.30 1.54 1.04 1.32 1.00 0.79 0.66 0.56 0.50 0.39 0.33 0.18 0.10 0.09 0.10 0.14 0.10 - 05-Nov-2019 - 05-Nov-2020 -05-Nov-2021 20 Y 30 YT 2:96 0.14 2 Yr 3 Yr 5 Yr 7 YT 10 YT 0.00 0.12 2:06 IVIO 6 1 Yr Date 1 Mo 2 Mo 3 Mo 6 Mo 05-Nov-2019 1.56 1.57 1.56 1.58 05-Nov-2020 0.09 0.10 0.10 0.10 05-Nov-2021 0.05 0.06 0.05 0.07 1 Yr 1.62 0.12 0.14 2 Yr 1.63 0.14 0.39 3 Yr 1.63 0.18 0.66 5 Yr 1.66 0.33 1.04 7 Yr 1.77 0.56 1.30 10 Yr 20 Y 30 Yr 1.86 2.17 2.34 0.79 1.32 1.54 1.45 1.88 1.87 Yield Curves, 5-Nov-19, 5-Nov-20 and 5-Nov-21 2.50 2.34 2.17 2.00 1.86 1.88 1.87 1.77 1.63 1.56 1.62 1.66 1.63 1.57 1.58 1.56 1.45 1.50 1.30 1.54 1.04 1.32 1.00 0.79 0.66 0.56 0.50 0.39 0.33 0.18 0.10 0.09 0.10 0.14 0.10 - 05-Nov-2019 - 05-Nov-2020 -05-Nov-2021 20 Y 30 YT 2:96 0.14 2 Yr 3 Yr 5 Yr 7 YT 10 YT 0.00 0.12 2:06 IVIO 6 1 Yr Date 1 Mo 2 Mo 3 Mo 6 Mo 05-Nov-2019 1.56 1.57 1.56 1.58 05-Nov-2020 0.09 0.10 0.10 0.10 05-Nov-2021 0.05 0.06 0.05 0.07 1 Yr 1.62 0.12 0.14 2 Yr 1.63 0.14 0.39 3 Yr 1.63 0.18 0.66 5 Yr 1.66 0.33 1.04 7 Yr 1.77 0.56 1.30 10 Yr 20 Y 30 Yr 1.86 2.17 2.34 0.79 1.32 1.54 1.45 1.88 1.87Step by Step Solution
There are 3 Steps involved in it
Step: 1

Get Instant Access to Expert-Tailored Solutions
See step-by-step solutions with expert insights and AI powered tools for academic success
Step: 2

Step: 3

Ace Your Homework with AI
Get the answers you need in no time with our AI-driven, step-by-step assistance
Get Started


