Answered step by step
Verified Expert Solution
Question
1 Approved Answer
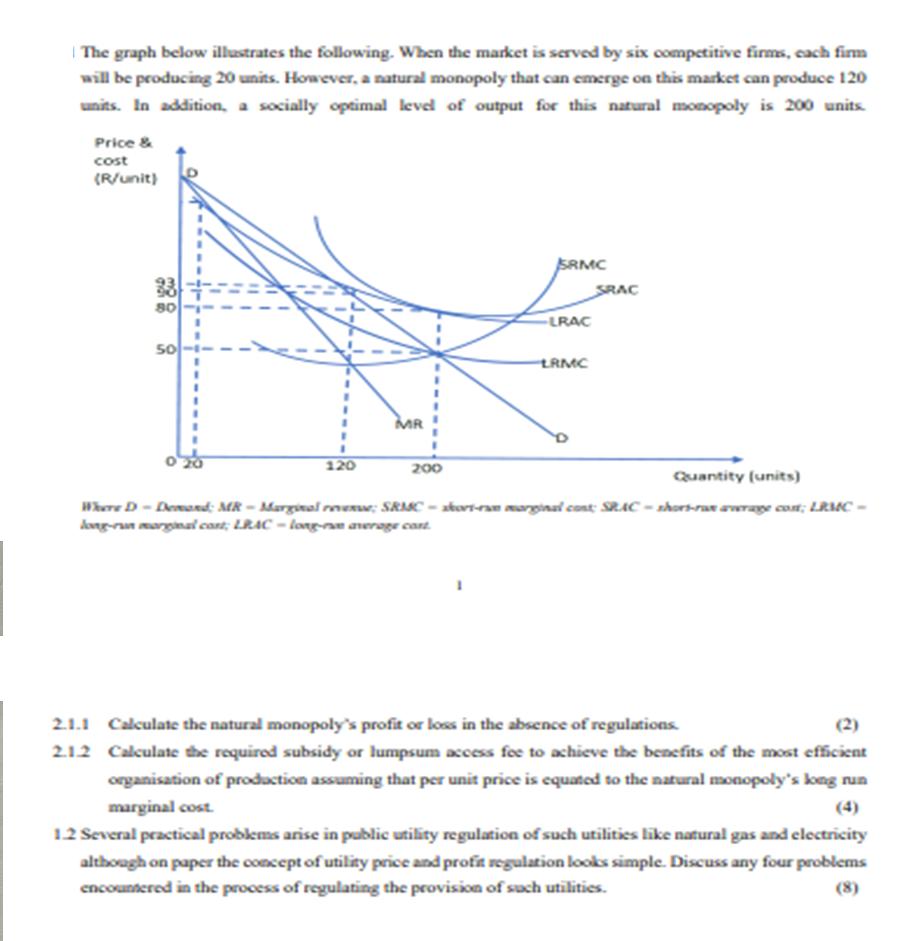
The graph below illustrates the following. When the market is served by six competitive firms, each firm will be producing 20 units. However, a

The graph below illustrates the following. When the market is served by six competitive firms, each firm will be producing 20 units. However, a natural monopoly that can emerge on this market can produce 120 units. In addition, a socially optimal level of output for this natural monopoly is 200 units. Price & cost (R/unit) 33 80 50 120 MR 200 SRMC -LRAC LRMC SRAC Quantity (units) Where D-Demand: MR-Marginal revenue; SRMC-short-ram marginal cont: SRAC-short-ran average cost; LRMC- long-run marginal cont; LRAC-long-n average cont 2.1.1 Calculate the natural monopoly's profit or loss in the absence of regulations. 2.1.2 Calculate the required subsidy or lumpsum access fee to achieve the benefits of the most efficient organisation of production assuming that per unit price is equated to the natural monopoly's long run marginal cost. 1.2 Several practical problems arise in public utility regulation of such utilities like natural gas and electricity although on paper the concept of utility price and profit regulation looks simple. Discuss any four problems encountered in the process of regulating the provision of such utilities. (8)
Step by Step Solution
★★★★★
3.43 Rating (153 Votes )
There are 3 Steps involved in it
Step: 1
11 To calculate the natural monopolys profit or loss in the absence of regulations we need to compare the Total Revenue TR with the Total Cost TC at t...
Get Instant Access to Expert-Tailored Solutions
See step-by-step solutions with expert insights and AI powered tools for academic success
Step: 2

Step: 3

Ace Your Homework with AI
Get the answers you need in no time with our AI-driven, step-by-step assistance
Get Started


