

Answered step by step
Verified Expert Solution
Question
1 Approved Answer
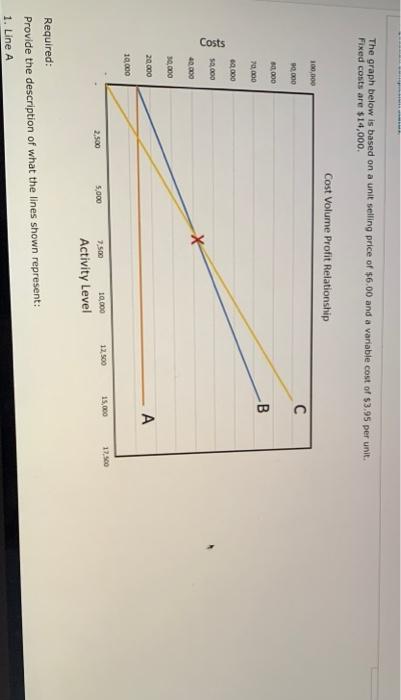
The graph below is based on a unit selling price of $6.00 and a variable cost of $3.95 per unit. Fixed costs are $14,000. Cost
Step by Step Solution
There are 3 Steps involved in it
Step: 1

Get Instant Access to Expert-Tailored Solutions
See step-by-step solutions with expert insights and AI powered tools for academic success
Step: 2

Step: 3
Ace Your Homework with AI
Get the answers you need in no time with our AI-driven, step-by-step assistance
Get Started
P7 Advanced Audit And Assurance Q And A 2013
Authors: ACCA Simplified
1st Edition
1492716626, 978-1492716624