Answered step by step
Verified Expert Solution
Link Copied!

Question

1 Approved Answer

The graph below plots the real GDP growth rate of the US from 2007 to 2020. Referring to the graph below, answer the following questions:
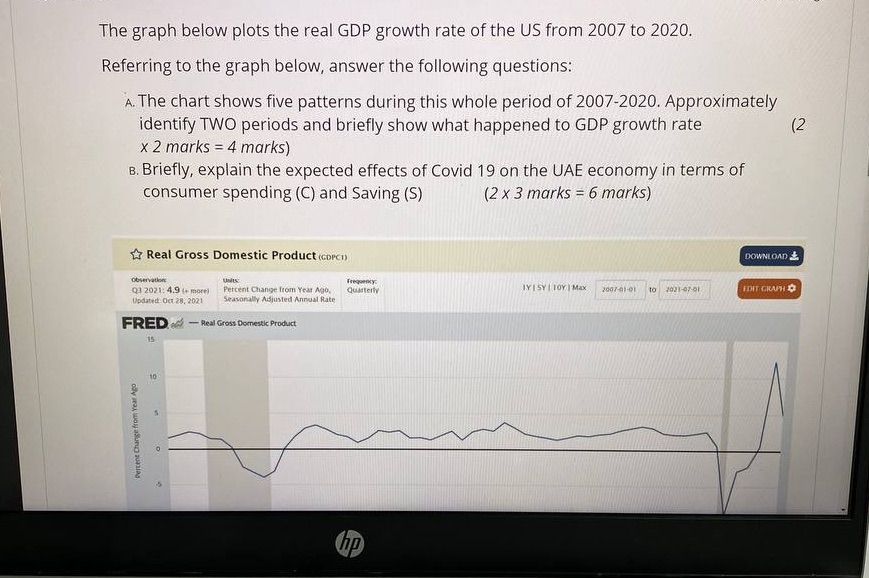
image text in transcribed
The graph below plots the real GDP growth rate of the US from 2007 to 2020. Referring to the graph below, answer the following questions: A. The chart shows five patterns during this whole period of 2007-2020. Approximately identify TWO periods and briefly show what happened to GDP growth rate (2 x 2 marks = 4 marks) B. Briefly, explain the expected effects of Covid 19 on the UAE economy in terms of consumer spending (C) and Saving (S) (2 x 3 marks = 6 marks) Real Gross Domestic Product (coPen) DOWNLOAD Q1 2021: 4.9 4+ morri Percent Change from Year Ago. IY I SY | TOY | MAX EDIT CRAPHI D Updated Oct 26, 2021 Seasonally Adjusted Annual Rate FRED .- Real Gross Domestic Product Percent Chinge Mom Yell Apo hp

Step by Step Solution

There are 3 Steps involved in it

Step: 1

blur-text-image

Get Instant Access to Expert-Tailored Solutions

See step-by-step solutions with expert insights and AI powered tools for academic success

Step: 2

blur-text-image_2

Step: 3

blur-text-image_3

Ace Your Homework with AI

Get the answers you need in no time with our AI-driven, step-by-step assistance

Get Started

Recommended Textbook for

Econometric Analysis

Authors: William H. Greene

5th Edition

130661899, 978-0130661890

More Books

Students also viewed these Economics questions

Question

What advice can you offer Julia to be a more effective leader?

Answered: 1 week ago

Question

What is polarization? Describe it with examples.

Answered: 1 week ago

Question

=+ How does this differ from the Solow model?

Answered: 1 week ago