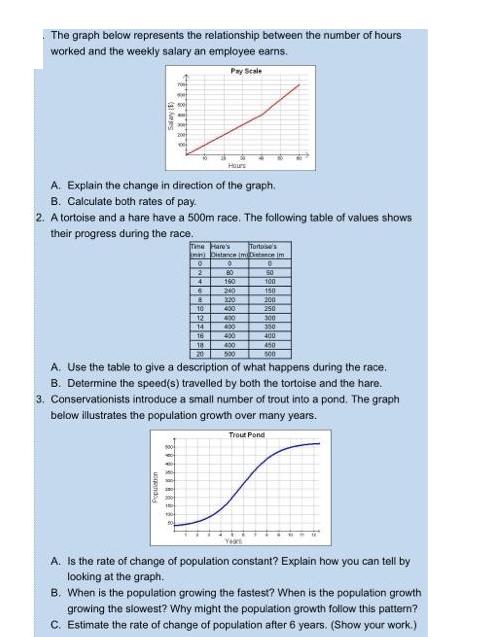
The graph below represents the relationship between the number of hours worked and the weekly salary an employee earns. Pay Scale TTTTTTT A. Explain

The graph below represents the relationship between the number of hours worked and the weekly salary an employee earns. Pay Scale TTTTTTT A. Explain the change in direction of the graph. B. Calculate both rates of pay. Hours 2. A tortoise and a hare have a 500m race. The following table of values shows their progress during the race. ucqndo Time Hare's Tortose's nin) Distance (mance im O RO 2 4 6 1.8 80 160 240 320 400 400 400 400 400 500 6 50 100 150 200 250 300 300 400 450 500 10 12 14 16 18 20 A. Use the table to give a description of what happens during the race. B. Determine the speed(s) travelled by both the tortoise and the hare. 3. Conservationists introduce a small number of trout into a pond. The graph below illustrates the population growth over many years. Trout Pond A. Is the rate of change of population constant? Explain how you can tell by looking at the graph. B. When is the population growing the fastest? When is the population growth growing the slowest? Why might the population growth follow this pattern? C. Estimate the rate of change of population after 6 years. (Show your work.)
Step by Step Solution
3.53 Rating (153 Votes )
There are 3 Steps involved in it
Step: 1

See step-by-step solutions with expert insights and AI powered tools for academic success
Step: 2

Step: 3

Ace Your Homework with AI
Get the answers you need in no time with our AI-driven, step-by-step assistance
Get Started


