Answered step by step
Verified Expert Solution
Link Copied!

Question

1 Approved Answer

The graph below shows the annual shipments of solar thermal collectors in the United States. Using the graph below, find the slope of the line
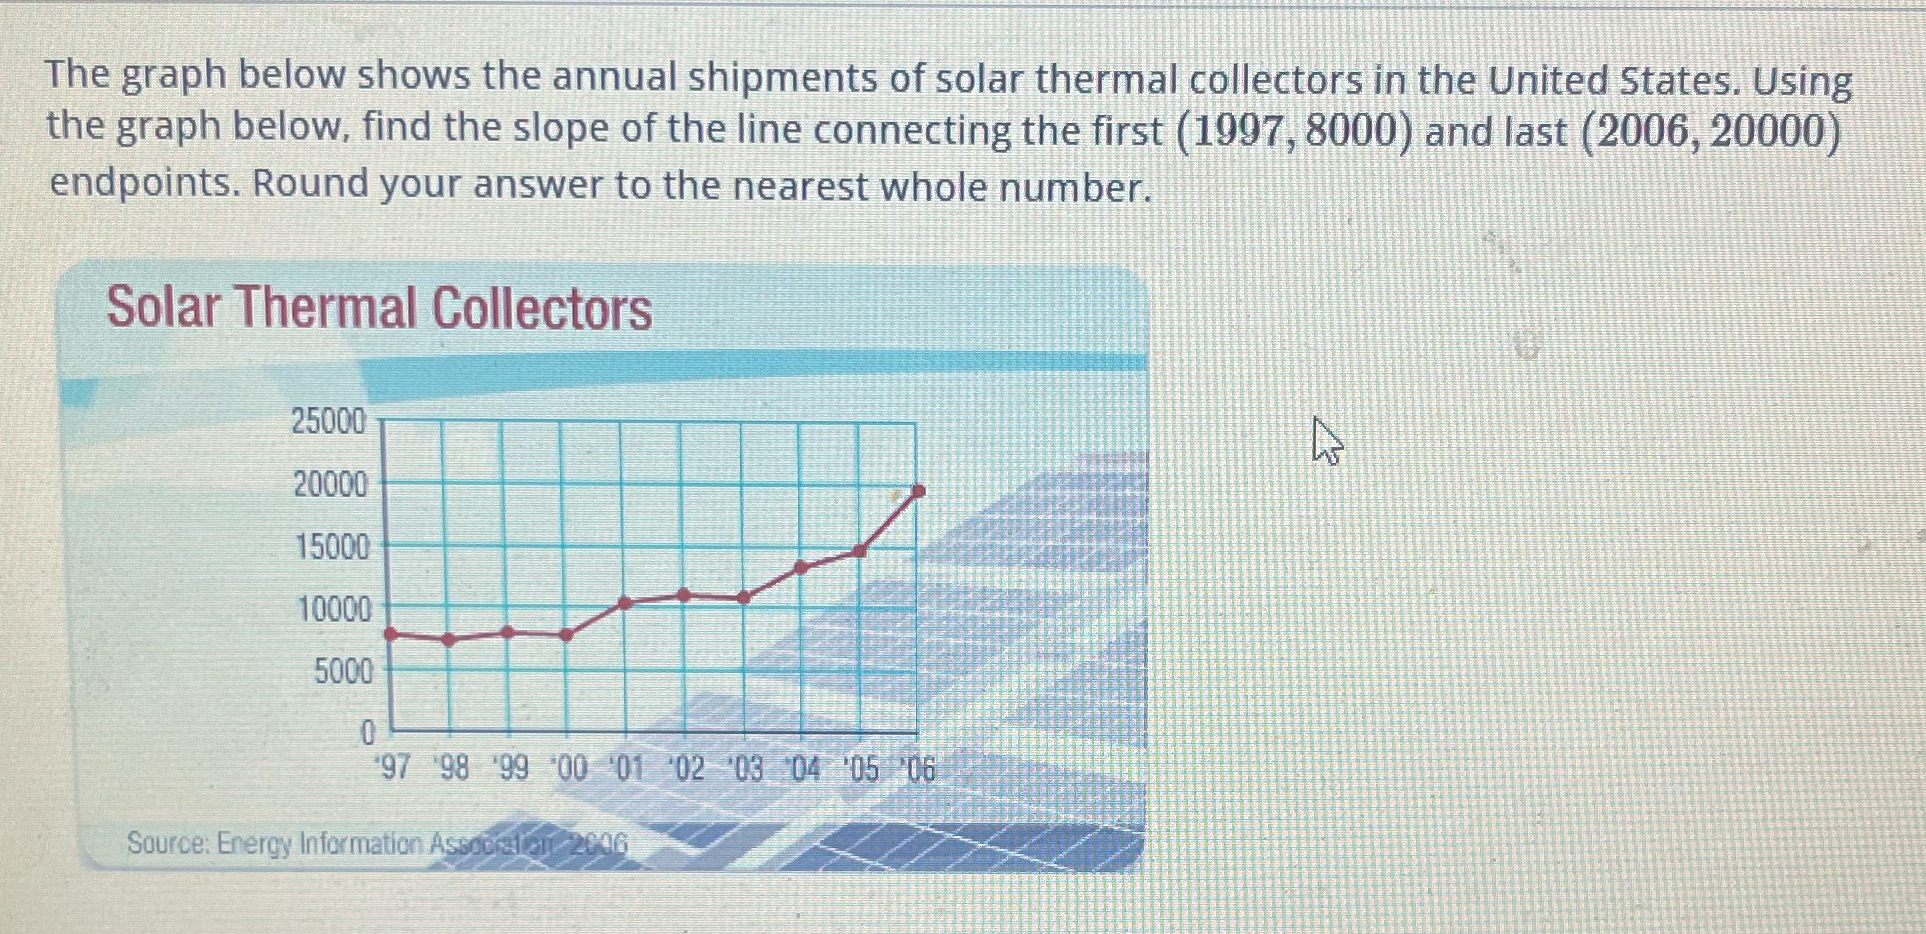
image text in transcribed
The graph below shows the annual shipments of solar thermal collectors in the United States. Using the graph below, find the slope of the line connecting the first (1997, 8000) and last (2006, 20000) endpoints. Round your answer to the nearest whole number. Solar Thermal Collectors 25000 20000 15000 10000 5000 0 '97 98 99 00 01 02 03 04 '05 06 Source: Energy Information Asscoral21 2096

Step by Step Solution

There are 3 Steps involved in it

Step: 1

blur-text-image

Get Instant Access to Expert-Tailored Solutions

See step-by-step solutions with expert insights and AI powered tools for academic success

Step: 2

blur-text-image

Step: 3

blur-text-image

Ace Your Homework with AI

Get the answers you need in no time with our AI-driven, step-by-step assistance

Get Started

Recommended Textbook for

Algebra Practice Sets 100 Problems And Solutions Volume 1

Authors: Sanjay Jamindar

1st Edition

1519534809, 978-1519534804

More Books

Students also viewed these Mathematics questions