Answered step by step
Verified Expert Solution
Question
1 Approved Answer
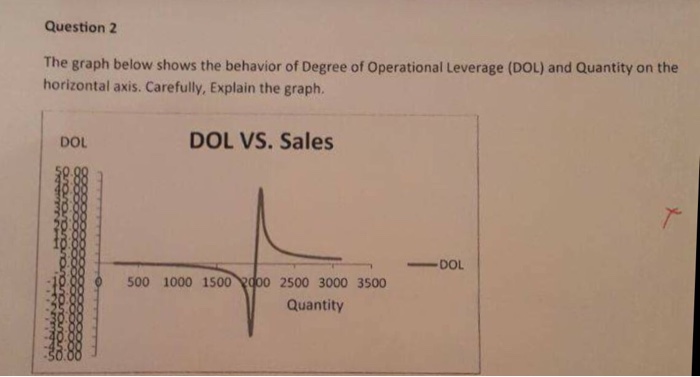
The graph below shows the behaviour of Degree of Operational Leverage (DOL) and Quantity on the horizontal axis. Carefully, Explain the graph
Step by Step Solution
There are 3 Steps involved in it
Step: 1

Get Instant Access to Expert-Tailored Solutions
See step-by-step solutions with expert insights and AI powered tools for academic success
Step: 2

Step: 3
Ace Your Homework with AI
Get the answers you need in no time with our AI-driven, step-by-step assistance
Get Started