Answered step by step
Verified Expert Solution
Question
1 Approved Answer
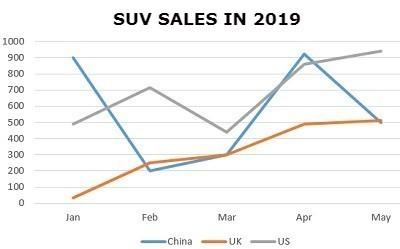
The graph below shows the number of SUVs sold (in thousands) in three countries in the year 2019. Describe and analyze the graph in terms

The graph below shows the number of SUVs sold (in thousands) in three countries in the year 2019. Describe and analyze the graph in terms of the trend shown in it.
Write about 180-200 words in three paragraphs.

This is a sample question
Please solve quickly
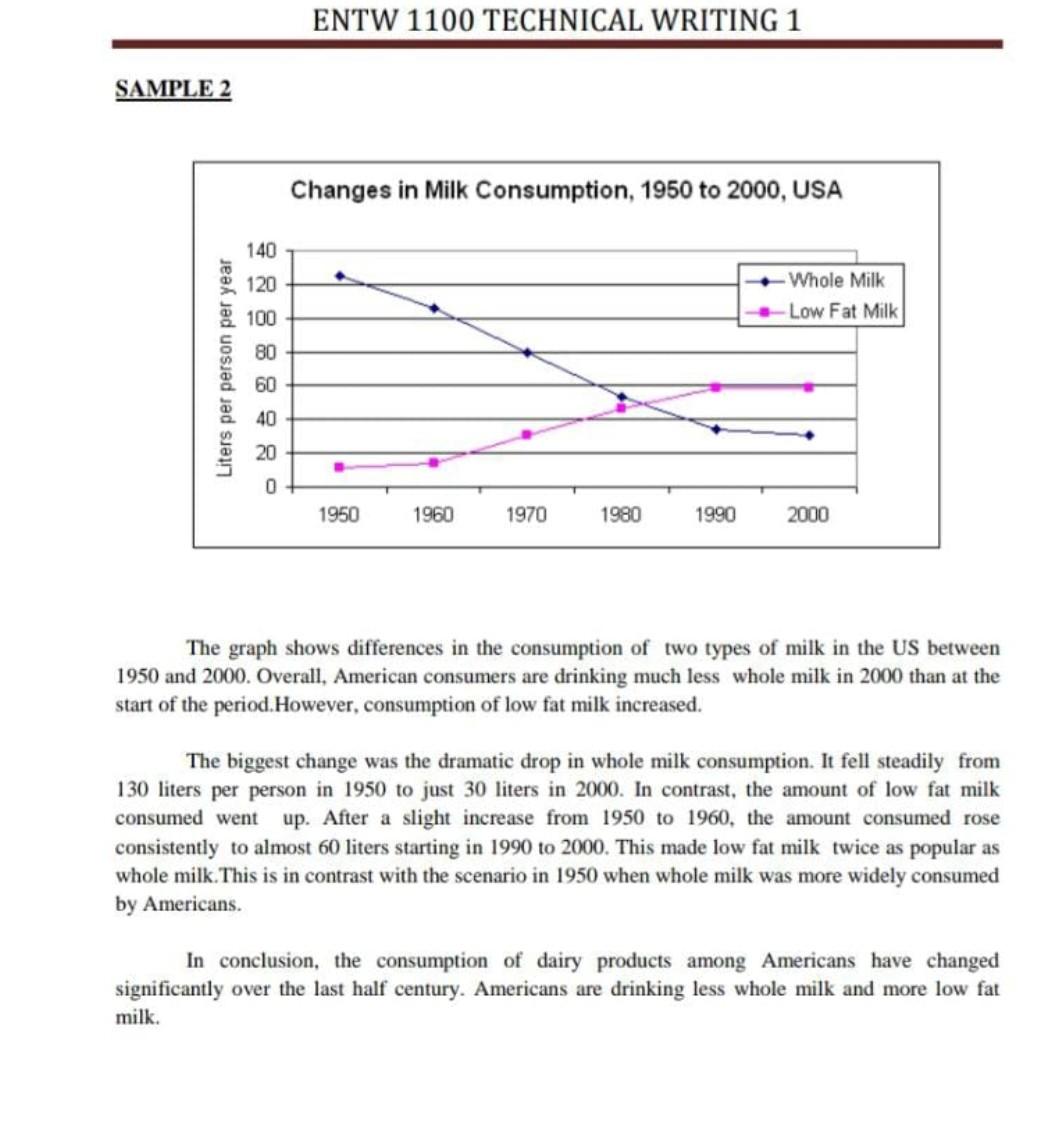
SUV SALES IN 2019 1000 900 800 700 600 500 400 300 200 100 0 Jan Feb Mar Apr May China UK US ENTW 1100 TECHNICAL WRITING 1 SAMPLE 2 Changes in Milk Consumption, 1950 to 2000, USA 140 120 Whole Milk -Low Fat Milk 100 80 Liters per person per year 60 40 20 0 1950 1960 1970 1980 1990 2000 The graph shows differences in the consumption of two types of milk in the US between 1950 and 2000. Overall, American consumers are drinking much less whole milk in 2000 than at the start of the period. However, consumption of low fat milk increased. The biggest change was the dramatic drop in whole milk consumption. It fell steadily from 130 liters per person in 1950 to just 30 liters in 2000. In contrast, the amount of low fat milk consumed went up. After a slight increase from 1950 to 1960, the amount consumed rose consistently to almost 60 liters starting in 1990 to 2000. This made low fat milk twice as popular as whole milk. This is in contrast with the scenario in 1950 when whole milk was more widely consumed by Americans. In conclusion, the consumption of dairy products among Americans have changed significantly over the last half century. Americans are drinking less whole milk and more low fat milkStep by Step Solution
There are 3 Steps involved in it
Step: 1

Get Instant Access to Expert-Tailored Solutions
See step-by-step solutions with expert insights and AI powered tools for academic success
Step: 2

Step: 3

Ace Your Homework with AI
Get the answers you need in no time with our AI-driven, step-by-step assistance
Get Started


