Answered step by step
Verified Expert Solution
Link Copied!

Question

1 Approved Answer

The graph below shows the sale of various goods in Modern Agencies in two separate years: 2003 and 2013 Summarise the information by selecting and
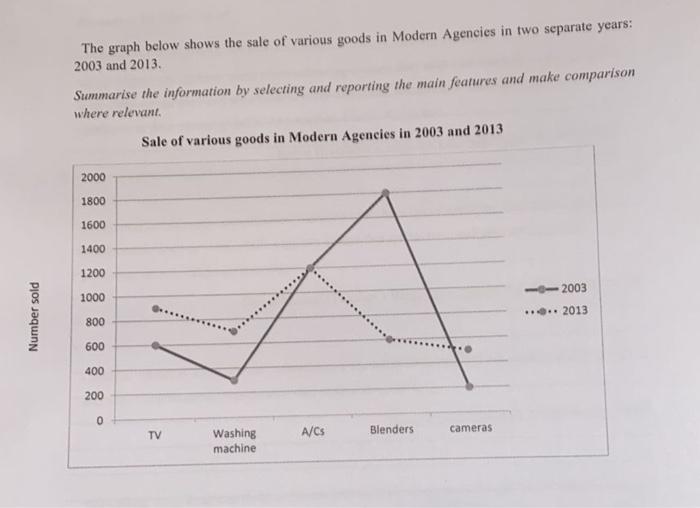
image text in transcribed
The graph below shows the sale of various goods in Modern Agencies in two separate years: 2003 and 2013 Summarise the information by selecting and reporting the main features and make comparison where relevant Sale of various goods in Modern Agencies in 2003 and 2013 2000 1800 1600 1400 1200 1000 Number sold 2003 .. 2013 800 600 400 200 0 A/CS Blenders TV cameras Washing machine

Step by Step Solution

There are 3 Steps involved in it

Step: 1

blur-text-image

Get Instant Access to Expert-Tailored Solutions

See step-by-step solutions with expert insights and AI powered tools for academic success

Step: 2

blur-text-image_2

Step: 3

blur-text-image_3

Ace Your Homework with AI

Get the answers you need in no time with our AI-driven, step-by-step assistance

Get Started

Recommended Textbook for

International financial management

Authors: Jeff Madura

9th Edition

978-0324593495, 324568207, 324568193, 032459349X, 9780324568202, 9780324568196, 978-0324593471

More Books

Students also viewed these Finance questions

Question

........ is closely related to output.

Answered: 1 week ago

Question

3-26. Was the senders purpose realistic?

Answered: 1 week ago

Question

10. True or false? If the statement is false, explain why: LO4

Answered: 1 week ago