

Answered step by step
Verified Expert Solution
Question
1 Approved Answer
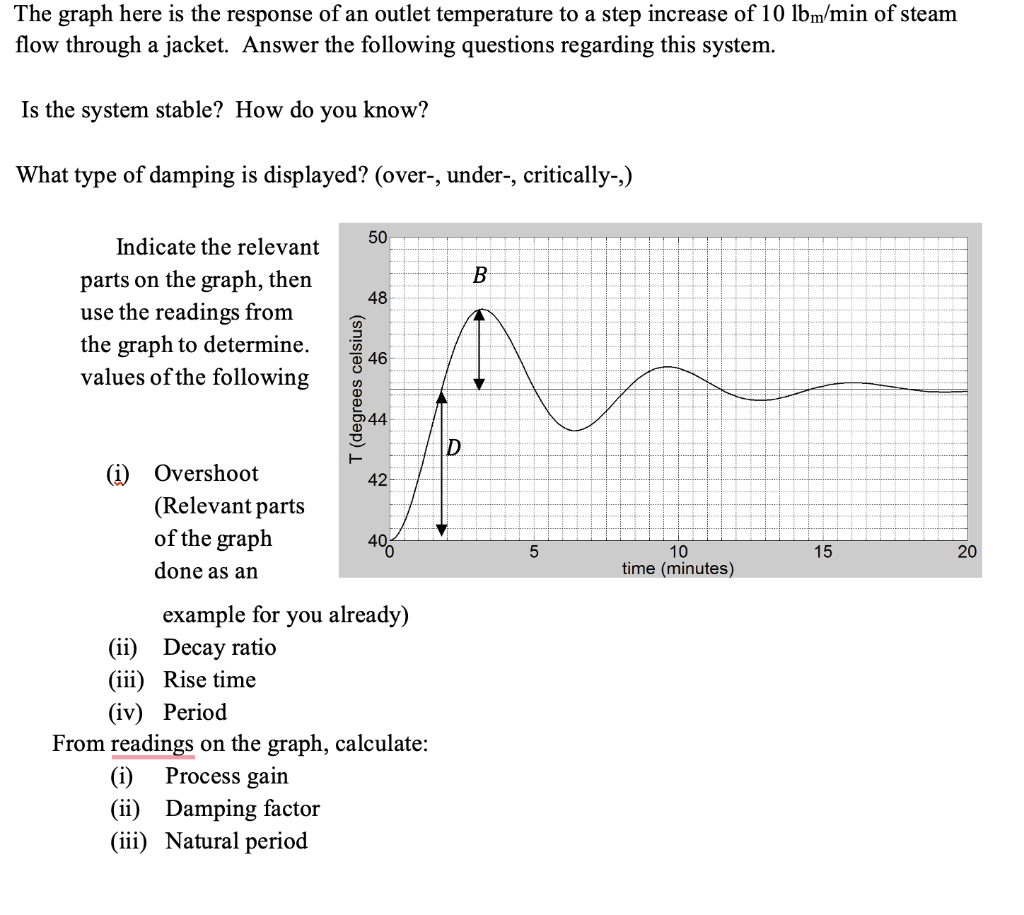
The graph here is the response of an outlet temperature to a step increase of 10lbm/min of steam flow through a jacket. Answer the following
Step by Step Solution
There are 3 Steps involved in it
Step: 1

Get Instant Access to Expert-Tailored Solutions
See step-by-step solutions with expert insights and AI powered tools for academic success
Step: 2

Step: 3
Ace Your Homework with AI
Get the answers you need in no time with our AI-driven, step-by-step assistance
Get Started
Fundamentals of Thermal-Fluid Sciences
Authors: Yunus A. Cengel, Robert H. Turner, John M. Cimbala
5th edition
78027680, 78027683, 9781760421359, 978-0078027680