Question
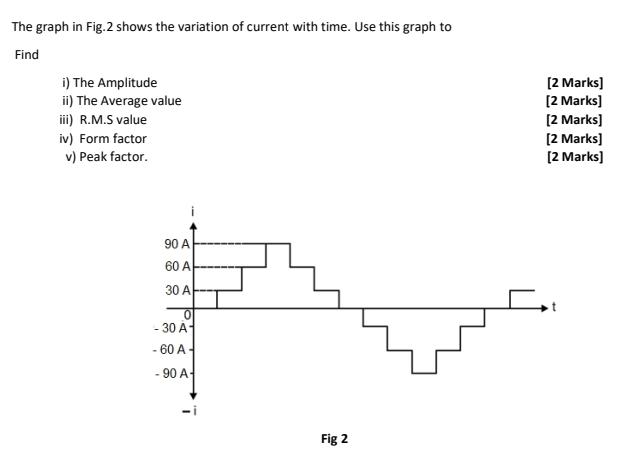
The graph in Fig.2 shows the variation of current with time. Use this graph to Find i) The Amplitude ii) The Average value iii)

The graph in Fig.2 shows the variation of current with time. Use this graph to Find i) The Amplitude ii) The Average value iii) R.M.S value iv) Form factor v) Peak factor. 90 A 60 A 30 A - 30 A - 60 A- - 90 A- Fig 2 [2 marks] [2 marks] [2 marks] [2 marks] [2 marks] t
Step by Step Solution
There are 3 Steps involved in it
Step: 1

Get Instant Access to Expert-Tailored Solutions
See step-by-step solutions with expert insights and AI powered tools for academic success
Step: 2

Step: 3

Ace Your Homework with AI
Get the answers you need in no time with our AI-driven, step-by-step assistance
Get StartedRecommended Textbook for
Modern Systems Analysis And Design
Authors: Joe Valacich, Joey George
9th Global Edition
1292351624, 978-1292351629
Students also viewed these Business Communication questions
Question
Answered: 1 week ago
Question
Answered: 1 week ago
Question
Answered: 1 week ago
Question
Answered: 1 week ago
Question
Answered: 1 week ago
Question
Answered: 1 week ago
Question
Answered: 1 week ago
Question
Answered: 1 week ago
Question
Answered: 1 week ago
Question
Answered: 1 week ago
Question
Answered: 1 week ago
Question
Answered: 1 week ago
Question
Answered: 1 week ago
Question
Answered: 1 week ago
Question
Answered: 1 week ago
Question
Answered: 1 week ago
Question
Answered: 1 week ago
Question
Answered: 1 week ago
Question
Answered: 1 week ago
Question
Answered: 1 week ago
Question
Answered: 1 week ago
View Answer in SolutionInn App


