Answered step by step
Verified Expert Solution
Question
1 Approved Answer
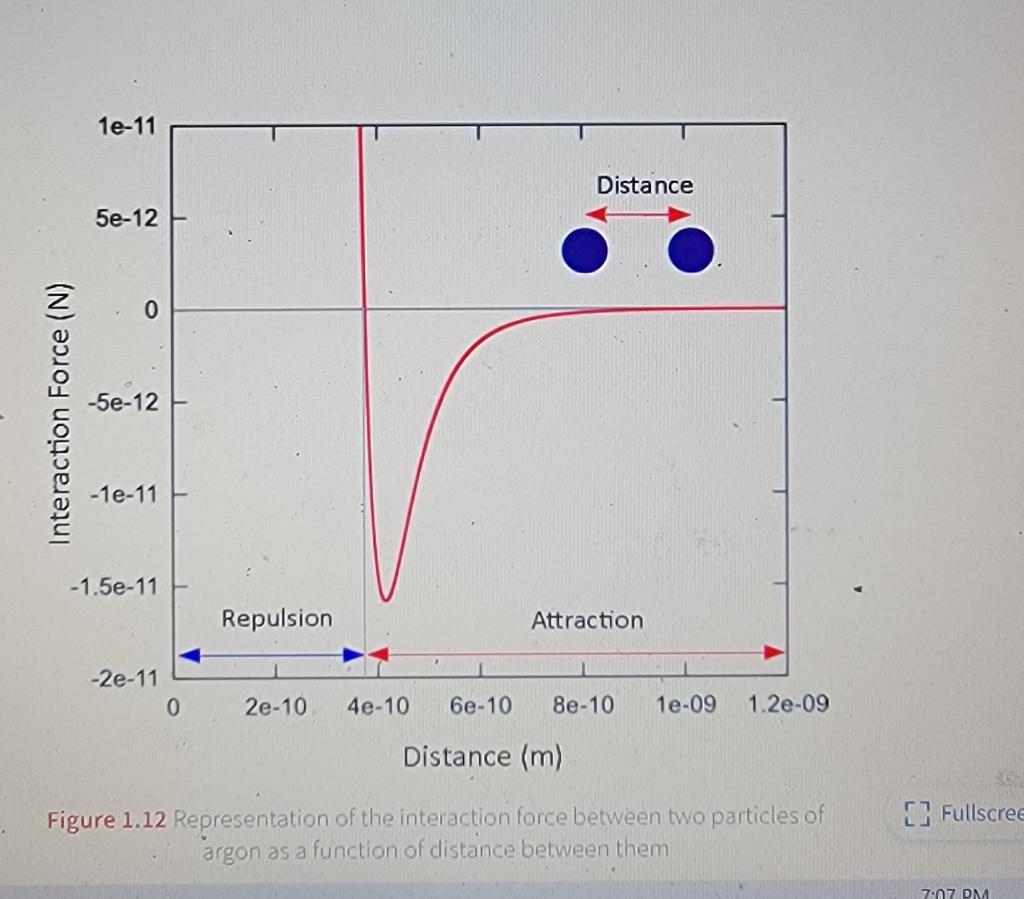
The graph in Figure 1.12 indicates that the attractive forces between two particles? a) Increases with increasing distance between particles b) Decreases with increasing distance
The graph in Figure 1.12 indicates that the attractive forces between two particles?

a) Increases with increasing distance between particles
b) Decreases with increasing distance between particles
c) Does not change with distance between particles
1e-11 Distance 5e-12 0 Interaction Force (N) -5e-12 -1e-11 -1.5e-11 Repulsion Attraction -2e-11 0 2e-10 4e-10 6e-10 Be-10 1e-09 1.2e-09 Distance (m) 3 [ Fullscree Figure 1.12 Representation of the interaction force between two particles of argon as a function of distance between them 7:07 PM
Step by Step Solution
There are 3 Steps involved in it
Step: 1

Get Instant Access to Expert-Tailored Solutions
See step-by-step solutions with expert insights and AI powered tools for academic success
Step: 2

Step: 3

Ace Your Homework with AI
Get the answers you need in no time with our AI-driven, step-by-step assistance
Get Started


