The graph is very important
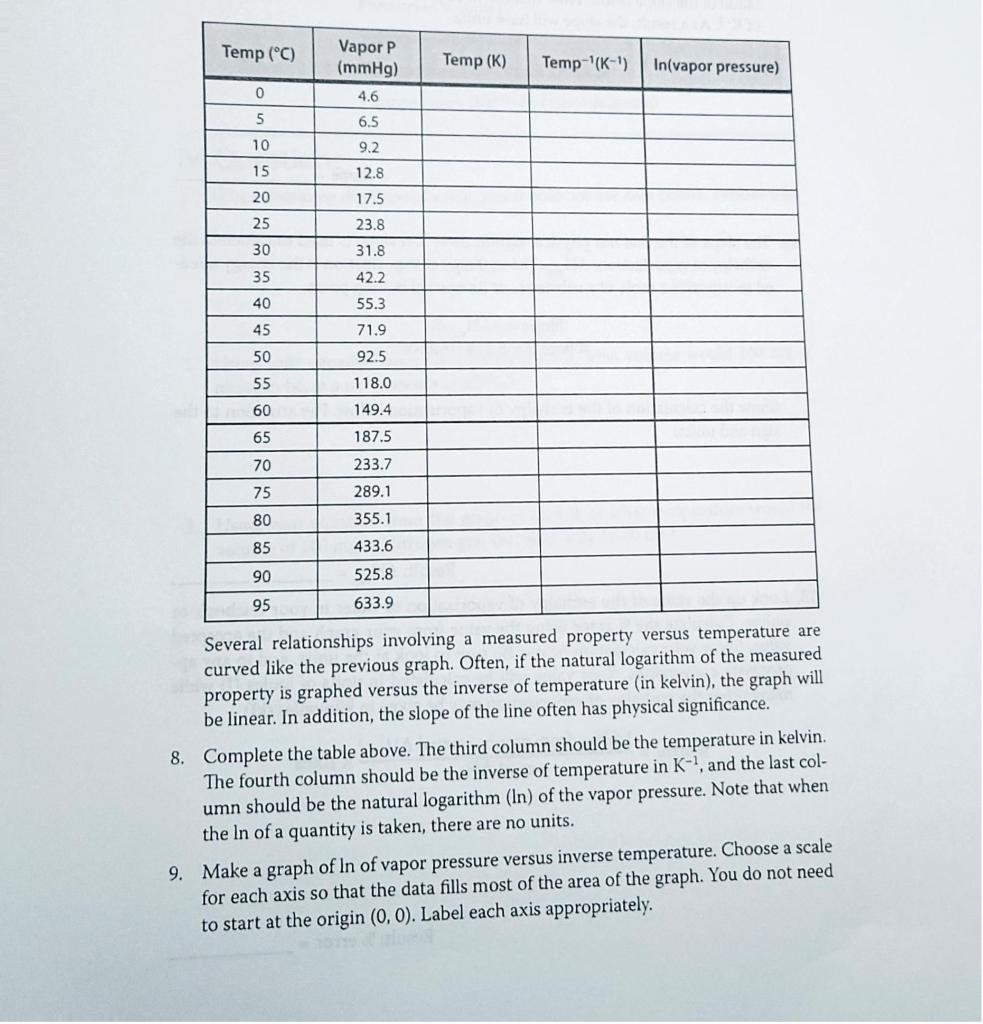
C. Vapor Pressure Curves The following table is a table of the vapor pressure of water at various temperatures. You will make two graphs using this data set. The first graph will illustrate the relationship between temperature and the vapor pressure of water. Although the data doesn't include the boiling point of water, you can extend the graph beyond the data points. This is called extrapolation. The line or curve representing the data is extended beyond the data points. 1. The first graph will be of the vapor pressure and temperature data on the table that follows. The independent variable goes along the x-axis, and the dependent variable goes along the y-axis. Many times, the temperature is considered the independent variable, and the other variable is changing as a result of the temperature change, making it the dependent variable. 2. You will extend the graph to beyond the data points to estimate the boiling point of water, so the scale must extend beyond the data on the following table. Choose a scale for the temperature axis that goes up to 110C and a scale for vapor pressure that goes up to 800mmHg. 3. Label each axis, showing the value every 5 or 10 lines. 4. Plot the data points by making small dots for each point and trace a line of best fit through the data. Extend this line beyond the data points up to a pressure of 800mmHg. 5. Put a title on the graph including any relevant information about the sample. 6. The normal boiling point of a substance is defined as the temperature at which the vapor pressure equals exactly 1 atmosphere, or 760mmHg. Using the extended line on your graph, determine the temperature at which the vapor pressure would equal one atmosphere. 7. Calculate the % error in the boiling point, and show your calculation below. %error=actualboilingpointboilingpointfromgraphactualboilingpoint100% Several relationships involving a measured property versus temperature are curved like the previous graph. Often, if the natural logarithm of the measured property is graphed versus the inverse of temperature (in kelvin), the graph will be linear. In addition, the slope of the line often has physical significance. 8. Complete the table above. The third column should be the temperature in kelvin. The fourth column should be the inverse of temperature in K1, and the last column should be the natural logarithm (In) of the vapor pressure. Note that when the In of a quantity is taken, there are no units. 9. Make a graph of ln of vapor pressure versus inverse temperature. Choose a scale for each axis so that the data fills most of the area of the graph. You do not need to start at the origin (0,0). Label each axis appropriately