Answered step by step
Verified Expert Solution
Link Copied!

Question

1 Approved Answer

The graph is very important Several relationships involving a measured property versus temperature are curved like the previous graph. Often, if the natural logarithm of

The graph is very important image text in transcribed
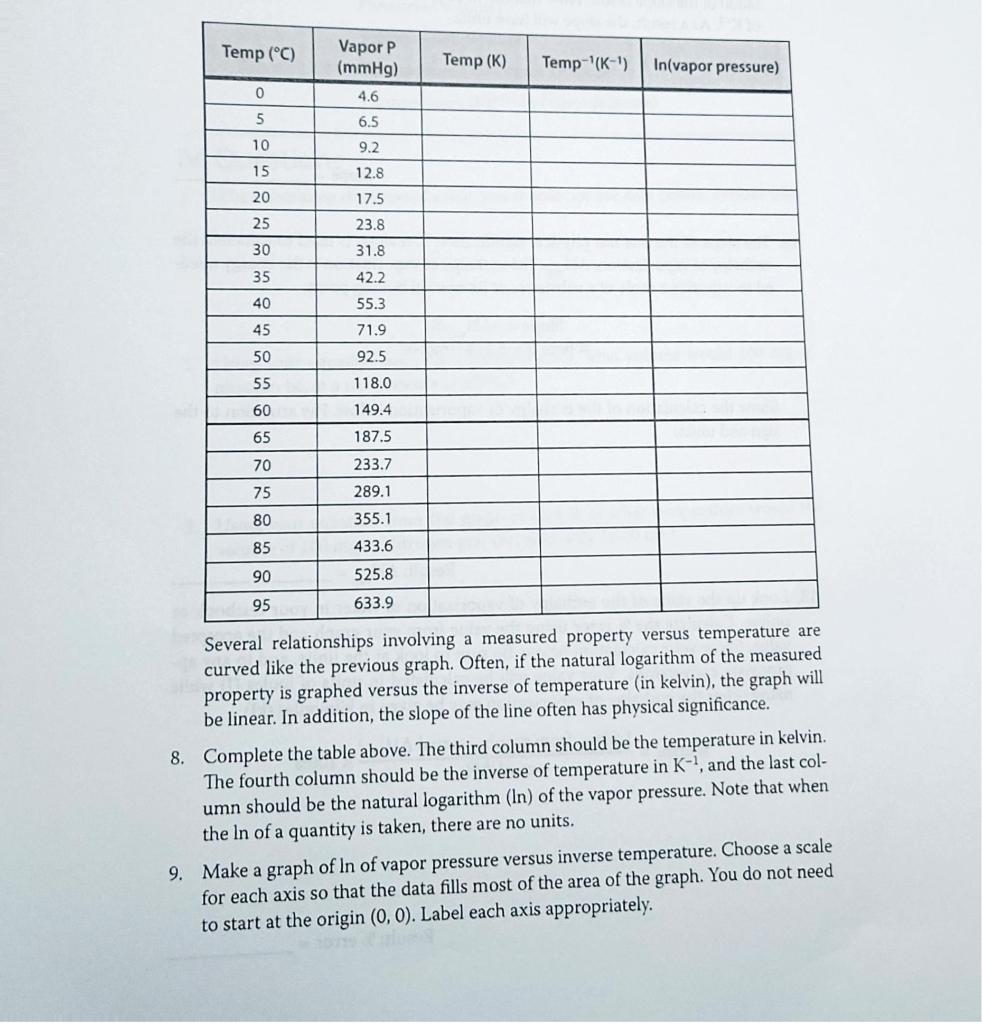
Several relationships involving a measured property versus temperature are curved like the previous graph. Often, if the natural logarithm of the measured property is graphed versus the inverse of temperature (in kelvin), the graph will be linear. In addition, the slope of the line often has physical significance. 8. Complete the table above. The third column should be the temperature in kelvin. The fourth column should be the inverse of temperature in K1, and the last column should be the natural logarithm (In) of the vapor pressure. Note that when the In of a quantity is taken, there are no units. 9. Make a graph of ln of vapor pressure versus inverse temperature. Choose a scale for each axis so that the data fills most of the area of the graph. You do not need to start at the origin (0,0). Label each axis appropriately

Step by Step Solution

There are 3 Steps involved in it

Step: 1

blur-text-image

Get Instant Access to Expert-Tailored Solutions

See step-by-step solutions with expert insights and AI powered tools for academic success

Step: 2

blur-text-image

Step: 3

blur-text-image

Ace Your Homework with AI

Get the answers you need in no time with our AI-driven, step-by-step assistance

Get Started

Recommended Textbook for

Quantitative Chemical Analysis

Authors: Daniel C. Harris, Charles A. Lucy

10th Edition

1319164307, 978-1319164300

More Books

Students also viewed these Chemistry questions