Answered step by step
Verified Expert Solution
Question
1 Approved Answer
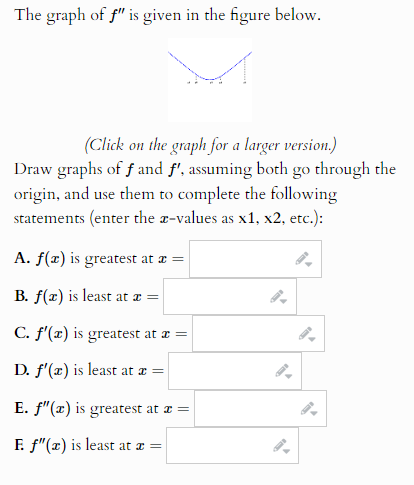
The graph of f ' ' is given in the figure below. ( Click on the graph for a larger version. ) Draw graphs of
The graph of is given in the figure below.
Click on the graph for a larger version.
Draw graphs of and assuming both go through the
origin, and use them to complete the following
statements enter the values as etc.:
A is greatest at
B is least at
C is greatest at
D is least at
E is greatest at
F is least at

Step by Step Solution
There are 3 Steps involved in it
Step: 1

Get Instant Access to Expert-Tailored Solutions
See step-by-step solutions with expert insights and AI powered tools for academic success
Step: 2

Step: 3

Ace Your Homework with AI
Get the answers you need in no time with our AI-driven, step-by-step assistance
Get Started


