

Answered step by step
Verified Expert Solution
Question
1 Approved Answer
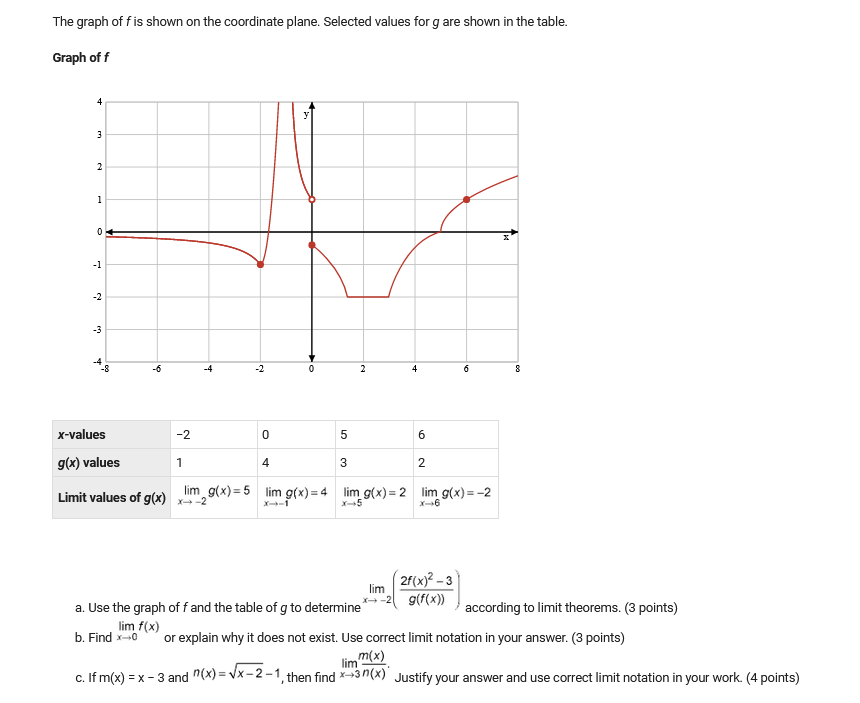
The graph of fis shown on the coordinate plane. Selected values for g are shown in the table. Graph of f 7 -1 -2 x-values

Step by Step Solution
There are 3 Steps involved in it
Step: 1

Get Instant Access to Expert-Tailored Solutions
See step-by-step solutions with expert insights and AI powered tools for academic success
Step: 2

Step: 3
Ace Your Homework with AI
Get the answers you need in no time with our AI-driven, step-by-step assistance
Get Started
Mathematics And Plausible Reasoning, Volume 1 Induction And Analogy In Mathematics
Authors: G Polya
1st Edition
0691218307, 9780691218304