

The graph of f(x)=8-x and the line I which is tangent to fat x = 1 is shown in the figure below. The equation
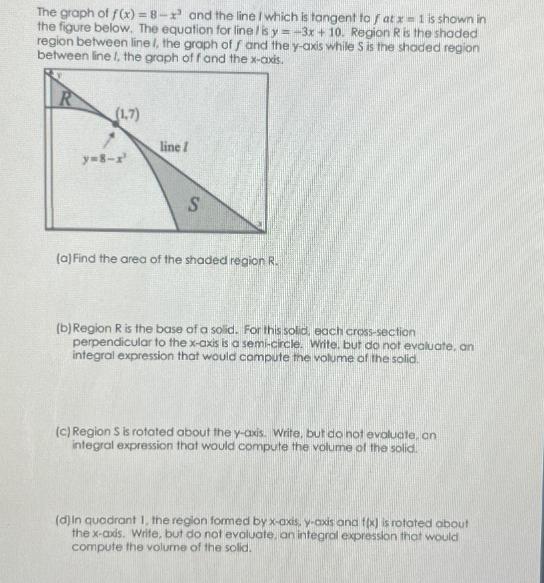
The graph of f(x)=8-x and the line I which is tangent to fat x = 1 is shown in the figure below. The equation for line / is y=-3x+10. Region R is the shaded region between line /, the graph off and the y-axis while S is the shaded region between line 1, the graph off and the x-axis. R (1,7) y=8-x line / S (a) Find the area of the shaded region R. (b) Region R is the base of a solid. For this solid, each cross-section perpendicular to the x-axis is a semi-circle. Write, but do not evaluate, an integral expression that would compute the volume of the solid. (c) Region S is rotated about the y-axis. Write, but do not evaluate, an integral expression that would compute the volume of the solid. (d) In quadrant 1, the region formed by x-axis, y-axis and f(x) is rotated about the x-axis. Write, but do not evaluate, an integral expression that would compute the volume of the solid.
Step by Step Solution
There are 3 Steps involved in it
Step: 1
Lets solve each part of the problem stepbystep a Find the area of the shaded region R The equations given in the problem are The function fx 8 x2 The ... View full answer

Get step-by-step solutions from verified subject matter experts
100% Satisfaction Guaranteed-or Get a Refund!
Step: 2Unlock detailed examples and clear explanations to master concepts

Step: 3Unlock to practice, ask and learn with real-world examples
See step-by-step solutions with expert insights and AI powered tools for academic success
-
 Access 30 Million+ textbook solutions.
-
Ask unlimited questions from AI Tutors.
-
Order free textbooks.
-
100% Satisfaction Guaranteed-or Get a Refund!
Claim Your Hoodie Now!

Authors: Gerald E. Whittenburg, Martha Altus Buller, Steven L Gill
31st Edition
1111972516, 978-1285586618, 1285586611, 978-1285613109, 978-1111972516

Study Smart with AI Flashcards
Access a vast library of flashcards, create your own, and experience a game-changing transformation in how you learn and retain knowledge
Explore Flashcards

