Question
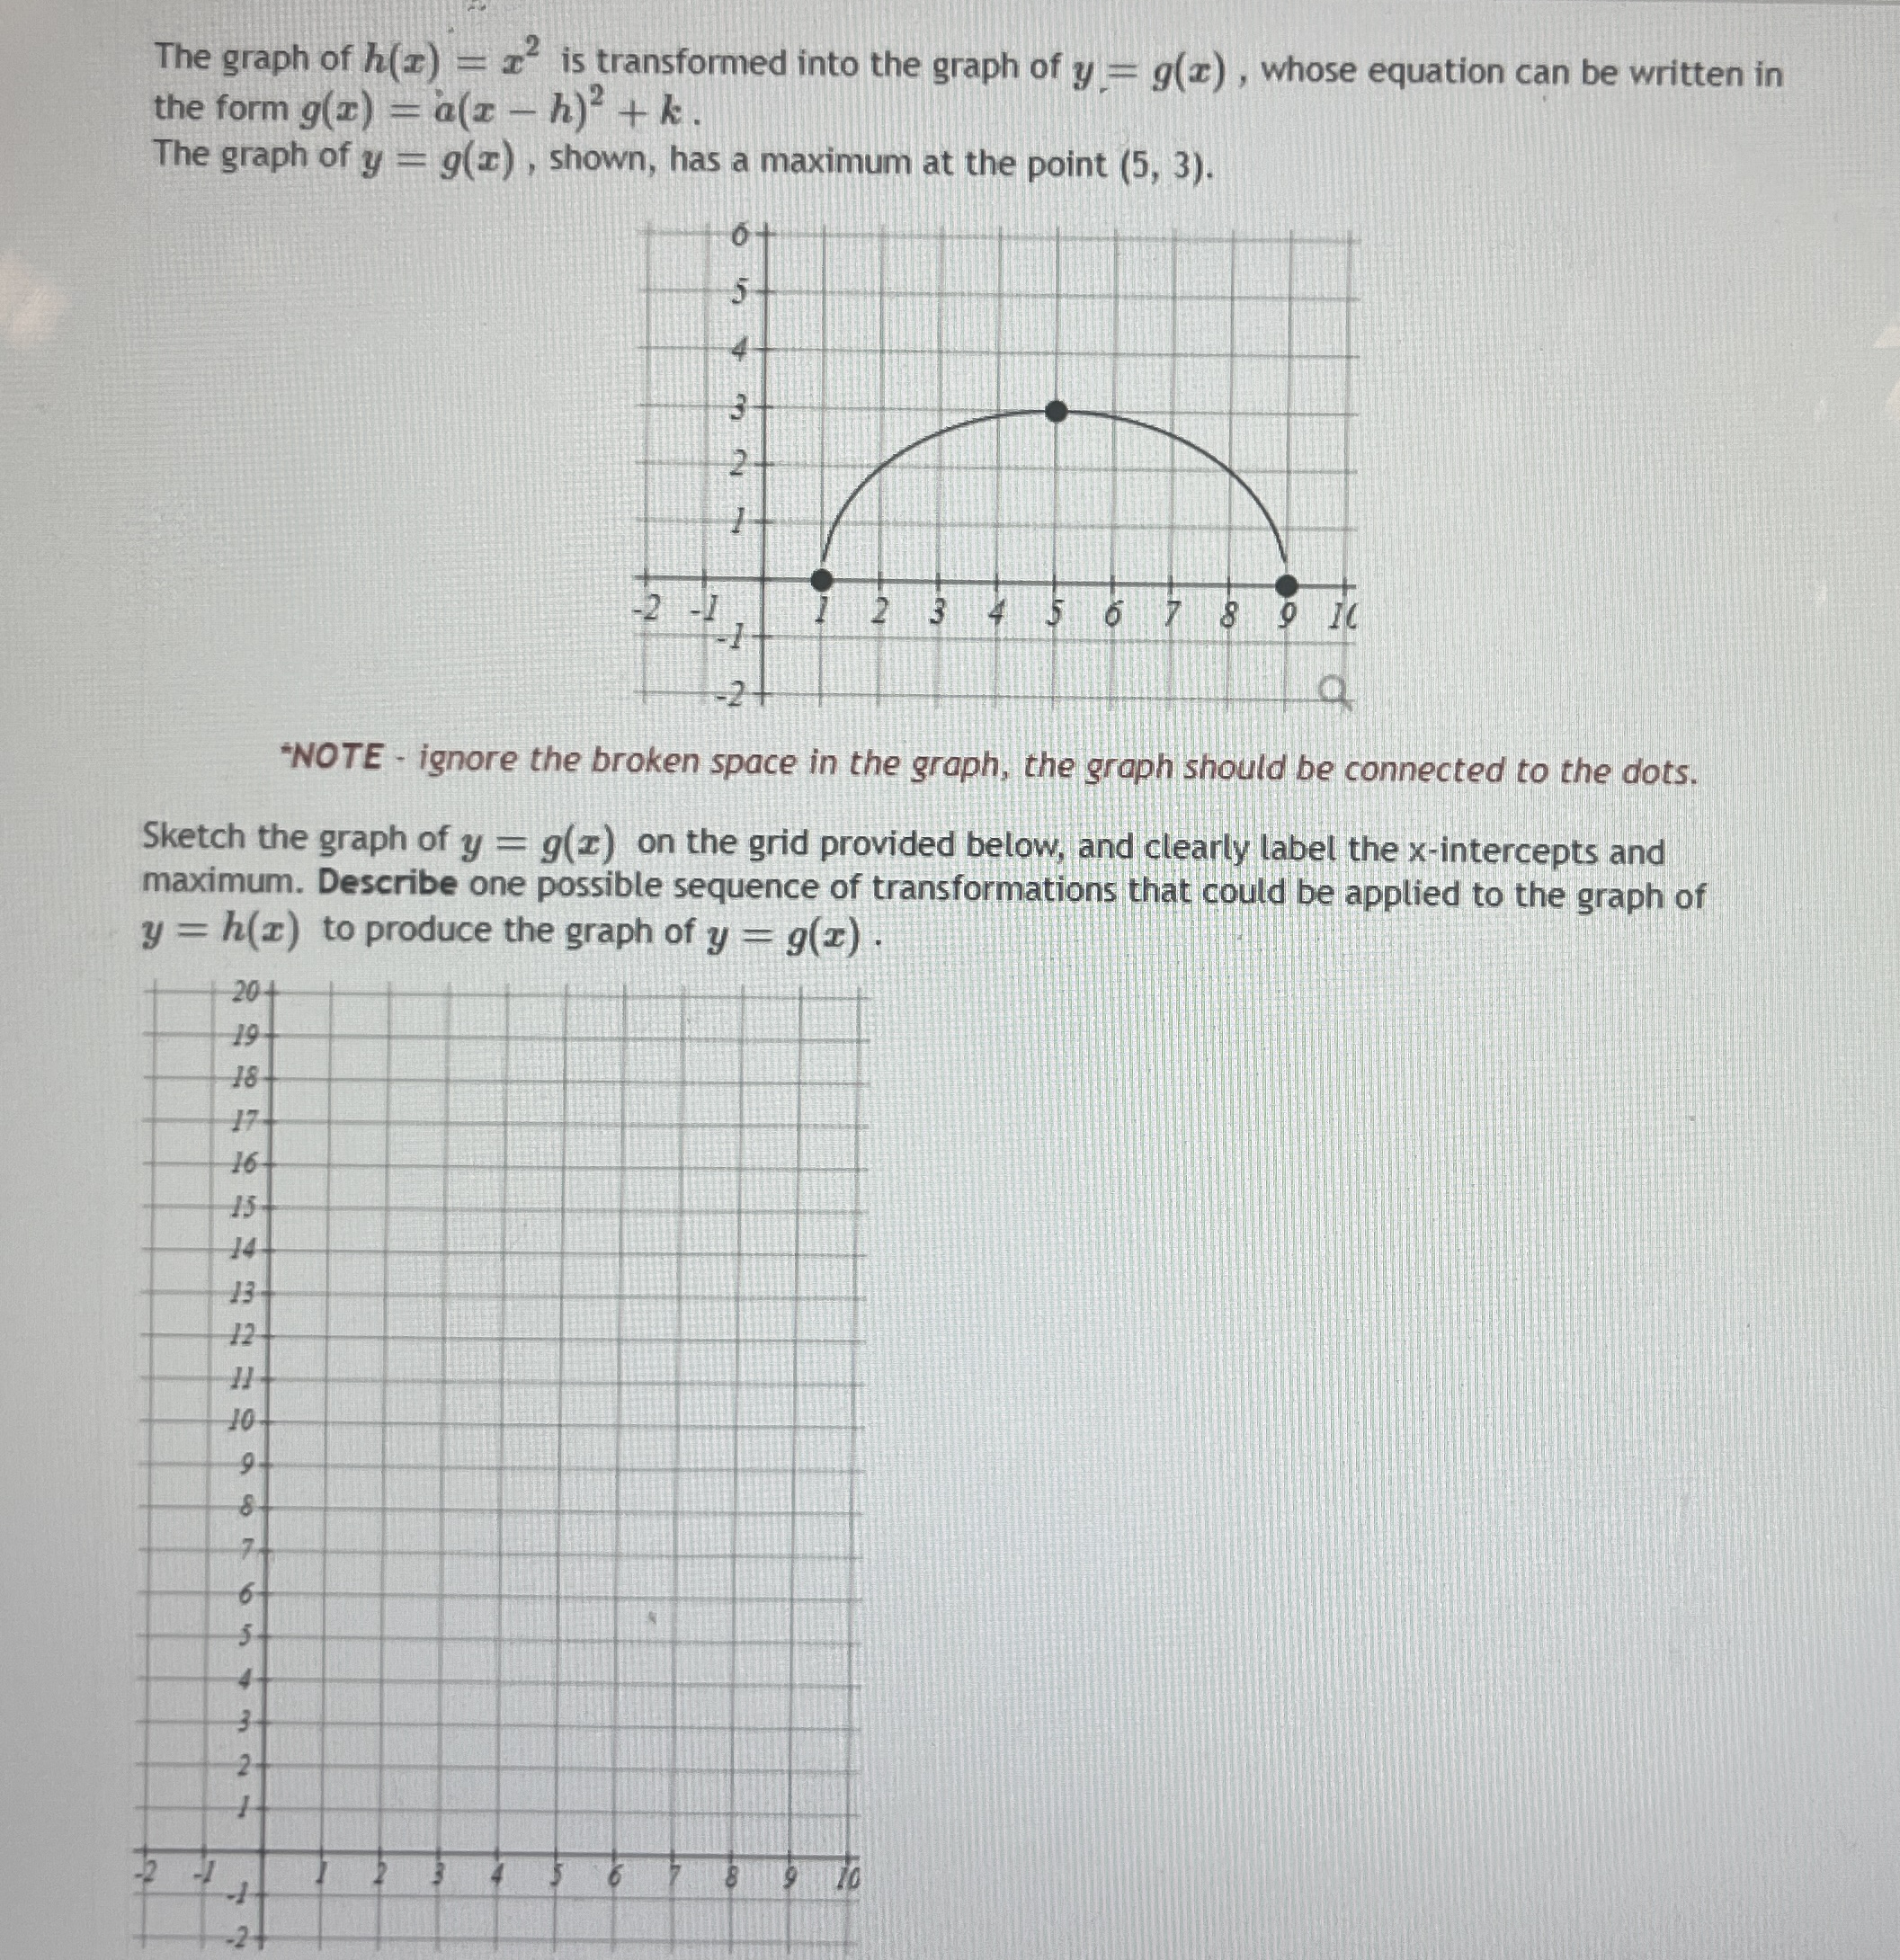
The graph of h(z) = is transformed into the graph of y = g(x), whose equation can be written in the form g(x) =

The graph of h(z) = is transformed into the graph of y = g(x), whose equation can be written in the form g(x) = a(zh) + k The graph of y = g(x), shown, has a maximum at the point (5, 3). 204 19 18 16 15 14 13 12 10 9 8 7 65 6 5 Sketch the graph of y = g(z) on the grid provided below, and clearly label the x-intercepts and maximum. Describe one possible sequence of transformations that could be applied to the graph of y = h(z) to produce the graph of y = g(x). 44 3 2 21 + -24 -2 6+ 5 3 4 36 + N 54 1 -1- -2+ *NOTE- ignore the broken space in the graph, the graph should be connected to the dots. 3 4 5 6 7 8 9 10 IC O Ca 9 10
Step by Step Solution
There are 3 Steps involved in it
Step: 1

Get Instant Access to Expert-Tailored Solutions
See step-by-step solutions with expert insights and AI powered tools for academic success
Step: 2

Step: 3

Ace Your Homework with AI
Get the answers you need in no time with our AI-driven, step-by-step assistance
Get StartedRecommended Textbook for
Matlab An Introduction with Applications
Authors: Amos Gilat
5th edition
1118629868, 978-1118801802, 1118801806, 978-1118629864
Students also viewed these Mathematics questions
Question
Answered: 1 week ago
Question
Answered: 1 week ago
Question
Answered: 1 week ago
Question
Answered: 1 week ago
Question
Answered: 1 week ago
Question
Answered: 1 week ago
Question
Answered: 1 week ago
Question
Answered: 1 week ago
Question
Answered: 1 week ago
Question
Answered: 1 week ago
Question
Answered: 1 week ago
Question
Answered: 1 week ago
Question
Answered: 1 week ago
Question
Answered: 1 week ago
Question
Answered: 1 week ago
Question
Answered: 1 week ago
Question
Answered: 1 week ago
Question
Answered: 1 week ago
Question
Answered: 1 week ago
Question
Answered: 1 week ago
Question
Answered: 1 week ago
Question
Answered: 1 week ago
View Answer in SolutionInn App


