

Answered step by step
Verified Expert Solution
Question
1 Approved Answer
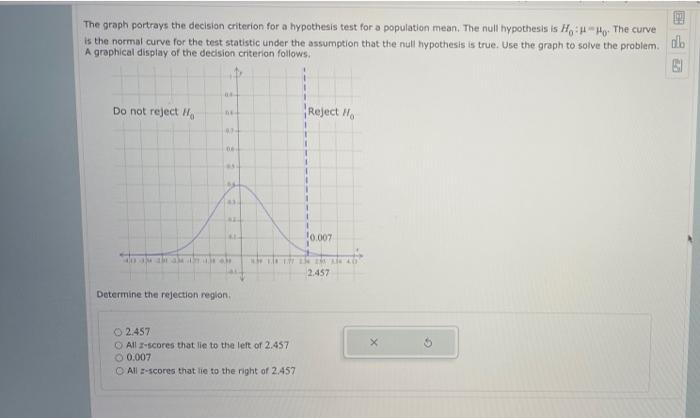
The graph portrays the decision criterion for a hypothesis test for a population mean. The null hypothesis is HoHo. The curve is the normal curve
Step by Step Solution
There are 3 Steps involved in it
Step: 1

Get Instant Access to Expert-Tailored Solutions
See step-by-step solutions with expert insights and AI powered tools for academic success
Step: 2

Step: 3
Ace Your Homework with AI
Get the answers you need in no time with our AI-driven, step-by-step assistance
Get Started
DOD Financial Management The Army Faces Significant Challenges In Achieving Audit Readiness For Its Military Pay
Authors: Government Accountability Office
1st Edition
1492310921, 978-1492310921