

Answered step by step
Verified Expert Solution
Question
1 Approved Answer
The graph shown is a horizontal stretch or compression of the graph of y = sinz. 2- -3 -2x -T 2 The equation of
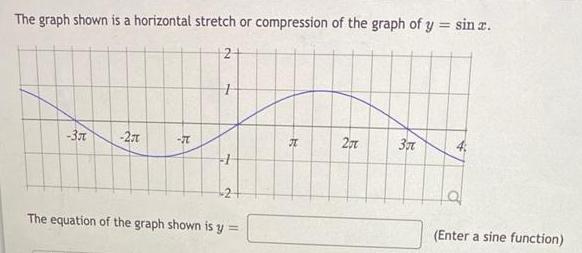
The graph shown is a horizontal stretch or compression of the graph of y = sinz. 2- -3 -2x -T 2 The equation of the graph shown is y a (Enter a sine function)
Step by Step Solution
There are 3 Steps involved in it
Step: 1

Get Instant Access to Expert-Tailored Solutions
See step-by-step solutions with expert insights and AI powered tools for academic success
Step: 2

Step: 3
Ace Your Homework with AI
Get the answers you need in no time with our AI-driven, step-by-step assistance
Get Started
College Algebra With Modeling And Visualization
Authors: Gary Rockswold
6th Edition
0134418042, 978-0134418049