Answered step by step
Verified Expert Solution
Link Copied!

Question

1 Approved Answer

The graph shows concentration as a function of time during a reaction of species Q and R to form species P. Select all the correct
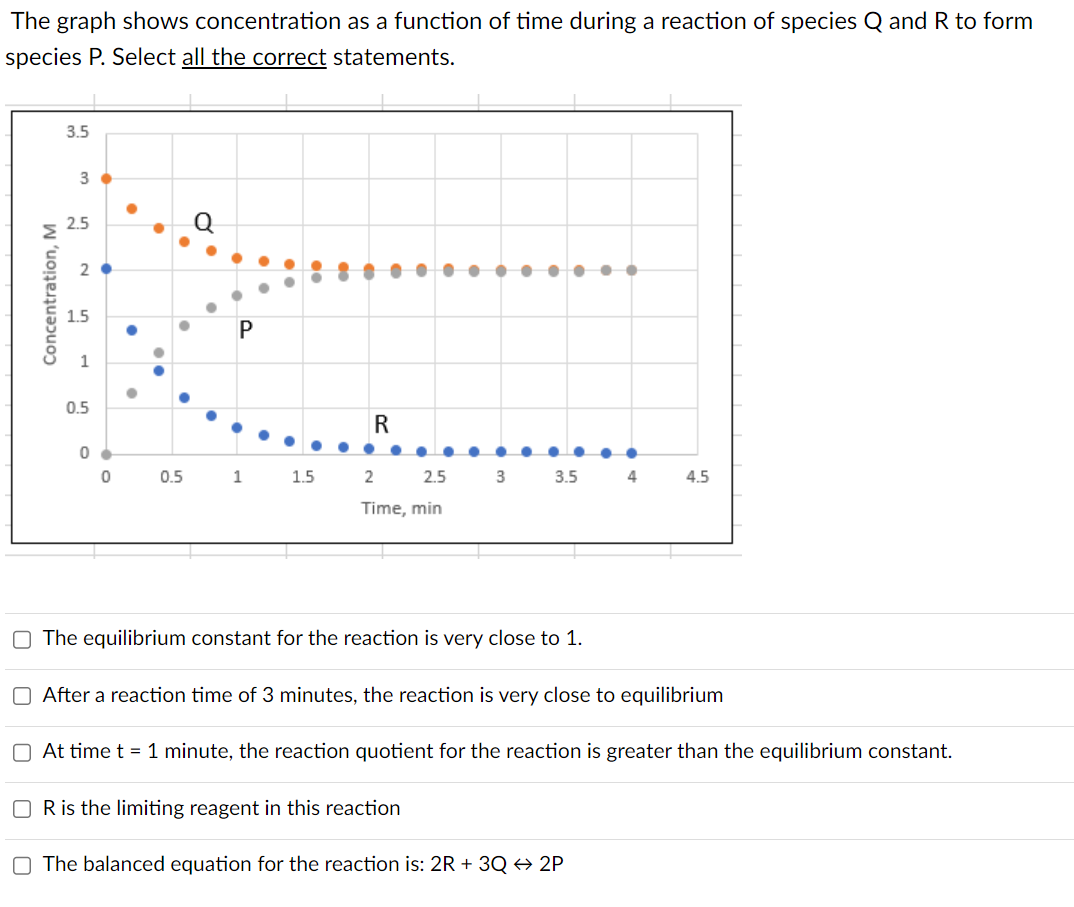
image text in transcribed

The graph shows concentration as a function of time during a reaction of species Q and R to form species P. Select all the correct statements. The equilibrium constant for the reaction is very close to 1. After a reaction time of 3 minutes, the reaction is very close to equilibrium At time t=1 minute, the reaction quotient for the reaction is greater than the equilibrium constant. R is the limiting reagent in this reaction The balanced equation for the reaction is: 2R+3Q2P

Step by Step Solution

There are 3 Steps involved in it

Step: 1

blur-text-image

Get Instant Access to Expert-Tailored Solutions

See step-by-step solutions with expert insights and AI powered tools for academic success

Step: 2

blur-text-image

Step: 3

blur-text-image

Ace Your Homework with AI

Get the answers you need in no time with our AI-driven, step-by-step assistance

Get Started

Recommended Textbook for

Oceanography An Invitation To Marine Science

Authors: Tom S Garrison

9th Edition

1305254287, 9781305254282

More Books

Students also viewed these Chemistry questions

Question

Explain the purpose of a measure of variation.

Answered: 1 week ago

Question

Why arent the other shipped orders without an invoice suspicious?

Answered: 1 week ago

Question

What is the average risk level for Arkansas (AR)?

Answered: 1 week ago

Question

Why do you think there are no write-offs in November and December?

Answered: 1 week ago