Answered step by step
Verified Expert Solution
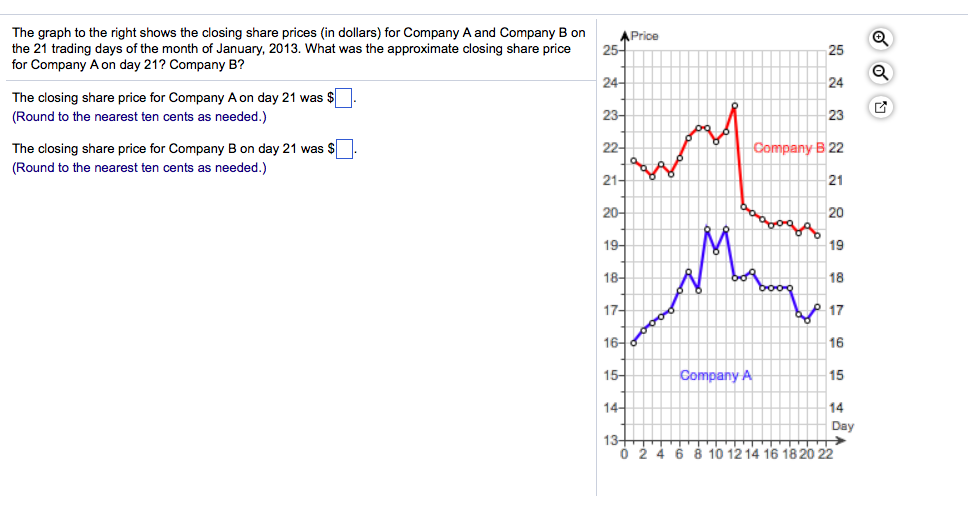
Link Copied!

Question

1 Approved Answer

The graph to the right shows the closing share prices (in dollars) for Company A and Company B onAPrice the 21 trading days of the

image text in transcribed

The graph to the right shows the closing share prices (in dollars) for Company A and Company B onAPrice the 21 trading days of the month of January, 2013. What was the approximate closing share price 25 for Company A on day 21? Company B? 25 24 23 24- The closing share price for Company Aon day 21 was $ (Round to the nearest ten cents as needed.) The closing share price for Company B on day 21 was s (Round to the nearest ten cents as needed.) Company B2 21 21 20 19 18 17 16 15 14 19- 18- 16- 15- CompanyA 14 Day 13 0 2 4 6 8 10 12 14 16 1820 22

Step by Step Solution

There are 3 Steps involved in it

Step: 1

blur-text-image

Get Instant Access to Expert-Tailored Solutions

See step-by-step solutions with expert insights and AI powered tools for academic success

Step: 2

blur-text-image

Step: 3

blur-text-image

Ace Your Homework with AI

Get the answers you need in no time with our AI-driven, step-by-step assistance

Get Started

Recommended Textbook for

The Politics Of Financial Risk Audit And Regulation

Authors: Atul Shah

1st Edition

1138042358, 978-1138042353

More Books

Students also viewed these Accounting questions

Question

Explain the meaning of hazards of litigation.

Answered: 1 week ago

Question

find all matrices A (a) A = 13 (b) A + A = 213

Answered: 1 week ago

Question

4 How can you create a better online image for yourself?

Answered: 1 week ago