

Question
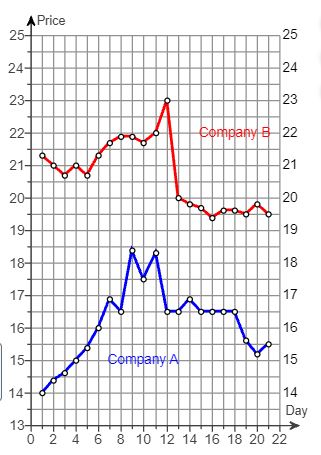
The graph to the right shows the closing share prices(in dollars) for Company A and Company B on the 21 trading days of the month
The graph to the right shows the closing share prices(in dollars) for Company A and Company B on the 21 trading days of the month ofJanuary, 2013. What was the highest closing share price for Company A and on what day did thisoccur?
The highest closing share price for Company A was $__________ on day ________.
(Round to the nearest ten cents asneeded.)
Step by Step Solution
There are 3 Steps involved in it
Step: 1

Get Instant Access to Expert-Tailored Solutions
See step-by-step solutions with expert insights and AI powered tools for academic success
Step: 2

Step: 3
Ace Your Homework with AI
Get the answers you need in no time with our AI-driven, step-by-step assistance
Get Started
Precalculus Enhanced With Graphing Utilities (Subscription)
Authors: Michael, Michael Sullivan III, Michael III Sullivan, III Sullivan
6th Edition
0321849108, 9780321849106