

Question
The graphical method can be used to estimate the parameters of several viscosity models for polymer fluids, as demonstrated in Figure 5-7 of the textbook.
The graphical method can be used to estimate the parameters of several viscosity models for polymer fluids, as demonstrated in Figure 5-7 of the textbook. Apply the graphical method to estimate the 3 parameters of the Cross-Model, for fitting the experimental viscosity data shown in problem 5-2 of the textbook.
In addition, calculate the time constant for the polymer.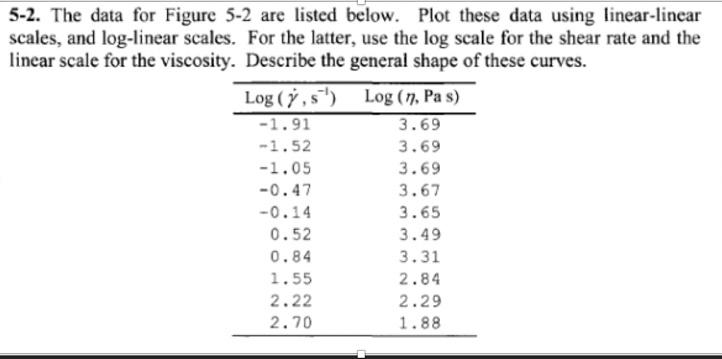
Step by Step Solution
There are 3 Steps involved in it
Step: 1

Get Instant Access to Expert-Tailored Solutions
See step-by-step solutions with expert insights and AI powered tools for academic success
Step: 2

Step: 3
Ace Your Homework with AI
Get the answers you need in no time with our AI-driven, step-by-step assistance
Get Started
Introduction To Chemical Engineering Thermodynamics
Authors: H.C. Smith, J.M. & Van Ness
2nd Edition
0070586993, 978-0070586994