Answered step by step
Verified Expert Solution
Question
1 Approved Answer
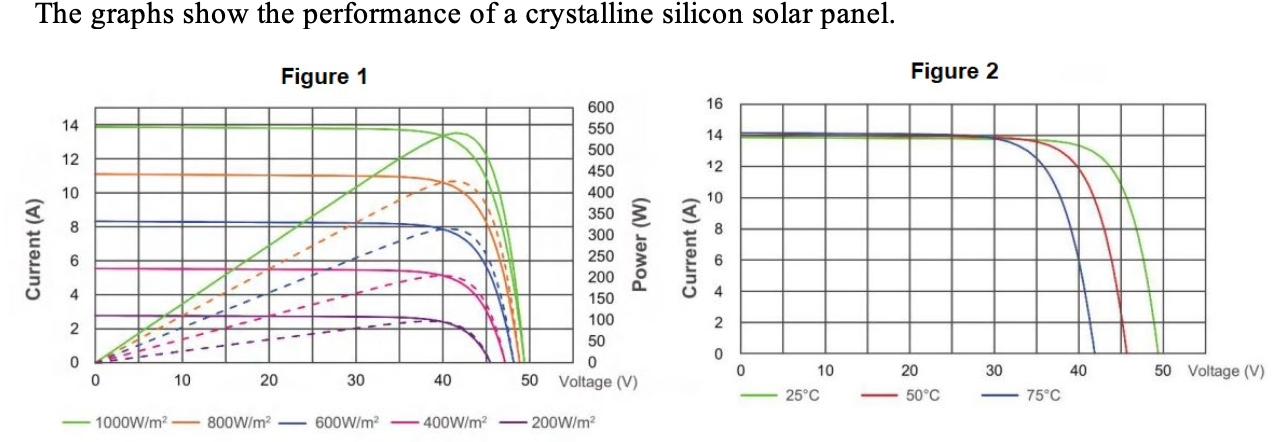
The graphs show the performance of a crystalline silicon solar panel. Figure 1 Current (A) 4 12 10 14 10 8 6 4 2


The graphs show the performance of a crystalline silicon solar panel. Figure 1 Current (A) 4 12 10 14 10 8 6 4 2 0 0 10 20 1000W/m- 800W/m 30 600W/m 40 -400W/m 600 550 500 450 400 350 300 Power (W) 250 200 150 100 50 0 50 Voltage (V) - 200W/m Current (A) 16 14 12 10 8 6 4 2 0 0 10 25C Figure 2 20 50C 30 a. The efficiency of the solar panel is the ratio of maximum power output to solar power input. The efficiency of the solar panel is given as 22.5%. From Figure 1, what is the area of the solar panel? b. The "fill factor" of a solar panel is the ratio of maximum power to the product of the cell short circuit current and open circuit voltage. Fill Factor = Pmax/IscVoc What is the Fill Factor for the solar panel at 1000 W/m? Is it the same at 200 W/m? c. Figure 2 shows the effect of temperature on cell efficiency. Cell efficiency decreases with temperature. The data were measured at 1000 W/m. Temperature dependence on cell efficiency can be expressed as nt no = 1-y(T-Tsc) = Where nt efficiency at a temperature T, no = efficiency at a standard temperature Tsc. The y is the constant of proportionality. The standard temperature is 25 deg.C. From Figure 2, what is the value of y?
Step by Step Solution
There are 3 Steps involved in it
Step: 1

Get Instant Access to Expert-Tailored Solutions
See step-by-step solutions with expert insights and AI powered tools for academic success
Step: 2

Step: 3

Ace Your Homework with AI
Get the answers you need in no time with our AI-driven, step-by-step assistance
Get Started


