

Answered step by step
Verified Expert Solution
Question
1 Approved Answer
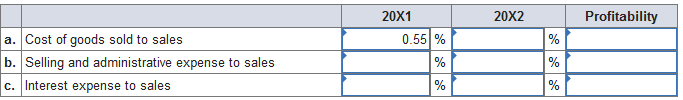
The Haines Corp. shows the following financial data for 20X1 and 20X2: 20X1 20X2 Sales $ 2,950,000 $ 3,380,000 Cost of goods sold 1,630,000 2,170,000
The Haines Corp. shows the following financial data for 20X1 and 20X2:
| 20X1 | 20X2 | ||||
| Sales | $ | 2,950,000 | $ | 3,380,000 | |
| Cost of goods sold | 1,630,000 | 2,170,000 | |||
| Gross profit | $ | 1,320,000 | $ | 1,210,000 | |
| Selling & administrative expense | 269,000 | 265,000 | |||
| Operating profit | $ | 1,051,000 | $ | 945,000 | |
| Interest expense | 45,400 | 46,600 | |||
| Income before taxes | $ | 1,005,600 | $ | 898,400 | |
| Taxes (35%) | 351,960 | 314,440 | |||
| Income after taxes | $ | 653,640 | $ | 583,960 | |
For each year, compute the following ratios and indicate how the change in each ratio will affect profitability in 20X2
Step by Step Solution
There are 3 Steps involved in it
Step: 1

Get Instant Access to Expert-Tailored Solutions
See step-by-step solutions with expert insights and AI powered tools for academic success
Step: 2

Step: 3
Ace Your Homework with AI
Get the answers you need in no time with our AI-driven, step-by-step assistance
Get Started
Managing Cash Flow An Operational Focus
Authors: Rob Reider, Peter B. Heyler
1st Edition
0471228095, 9780471228097