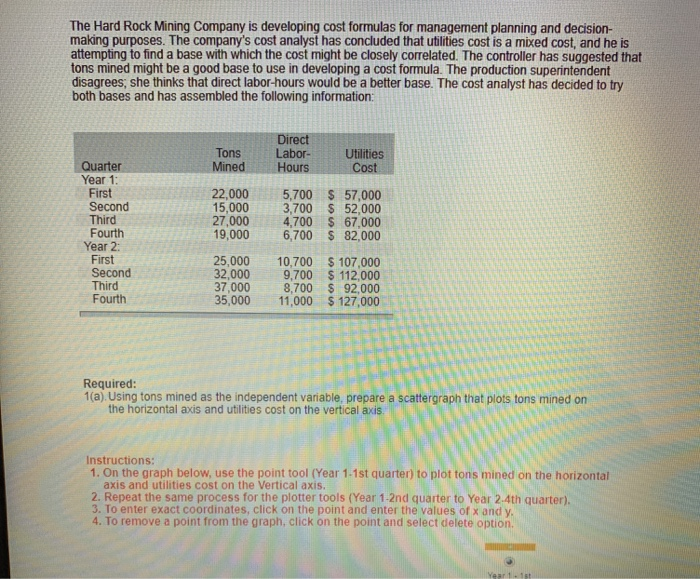
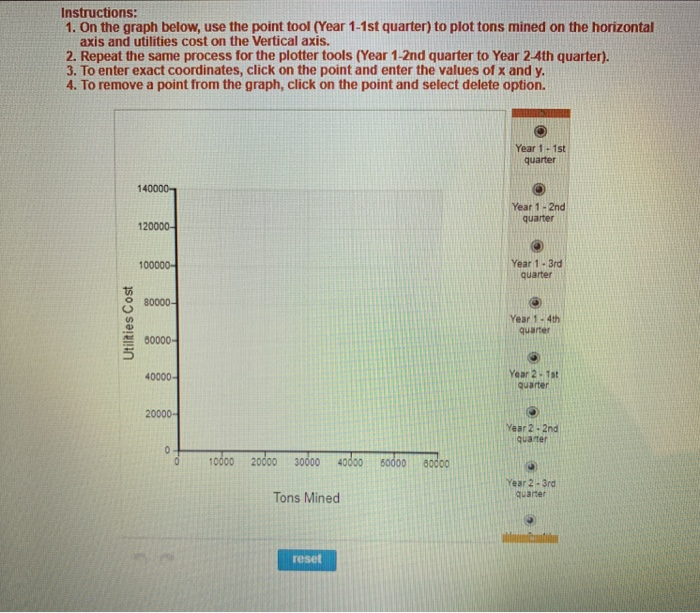
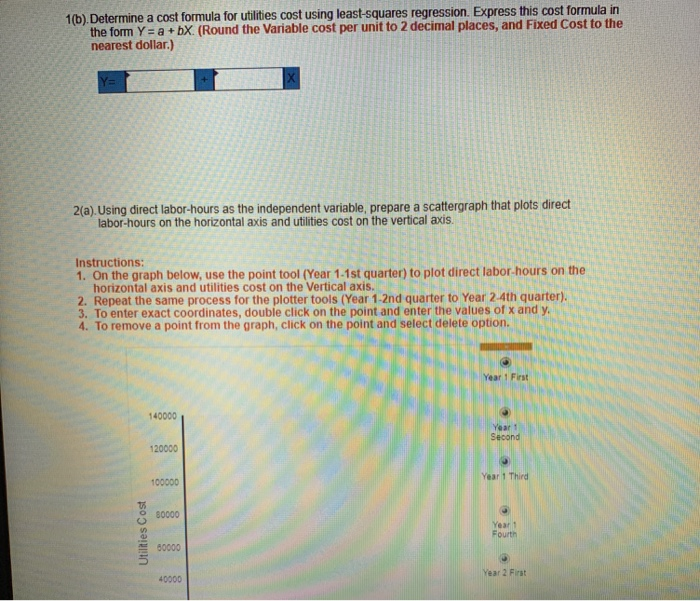
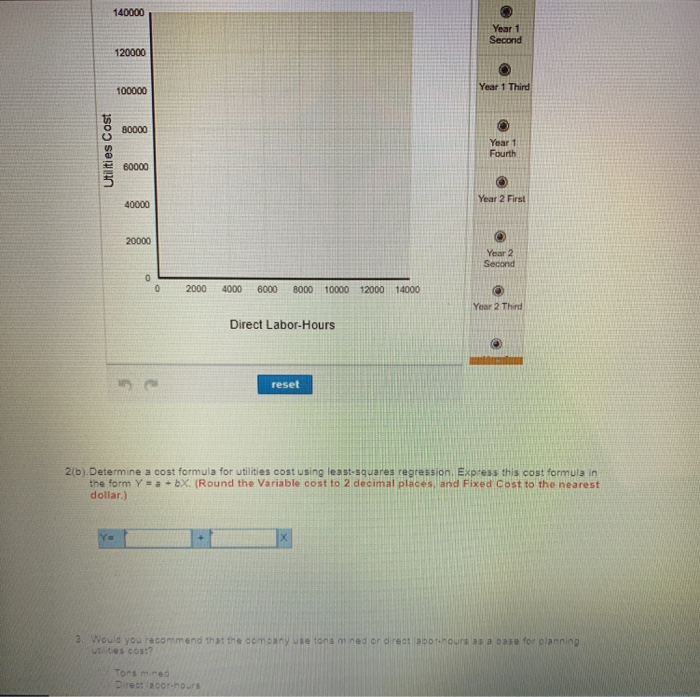
The Hard Rock Mining Company is developing cost formulas for management planning and decision- making purposes. The company's cost analyst has concluded that utbilities cost is a mixed cost, and he is attempting to find a base with which the cost might be closely correlated. The controller has suggested that tons mined might be a good base to use in developing a cost formula. The production superintendent disagrees, she thinks that direct labor-hours would be a better base. The cost analyst has decided to try both bases and has assembled the following information: Tons MinedHours Utilities Cost Labor Quarter Year 1 First Second Third Fourth 22,0005,700 S 57,000 5,0003,700 52,000 27,0004,700 $ 67,000 19,000 6,700 S 82,000 Year 2: Second Third Fourth 25,000 10,700 $ 107,000 32,000 9,700 $ 112,000 37,000 8,700 $ 92,000 35,000 11,000 127,000 Required: 1(a) Using tons mined as the independent variable, prepare a scattergraph that plots tons mined on the horizontal axis and utilities cost on the vertical axis Instructions: 1. On the graph below, use the point tool (Year 1-1st quarter) to plot tons mined on the horizontal axis and utilities cost on the Vertical axis 2. Repeat the same process for the plotter tools (Year 1-2nd quarter to Year 2.4th quarter), 3. To enter exact coordinates, click on the point and enter the values of x and y 4. To remove a point from the graph, click on the point and select delete option. Instructions: 1. On the graph below, use the point tool (Year 1-1st quarter) to plot tons mined on the horizontal axis and utilities cost on the Vertical axis. 2. Repeat the same process for the plotter tools (Year 1-2nd quarter to Year 2-4th quarter). 3. To enter exact coordinates, click on the point and enter the values of x and y 4. To remove a point from the graph, click on the point and select delete option. Year 1 - 1st quarter 140000 Year 1- 2nd quarter 120000 Year 1 3rd quarter 100000- O 80000- Year 1 - 4th quarter 60000 40000 Year 2. 1st qua 20000 Year 2- 2nd quater 10000 20000 30000 40 Year 2 3re quarter Tons Mined reset 1(b). Determine a cost formula for utilities cost using least-squares regression. Express this cost formula in the form Y- a + bX. (Round the Variable cost per unit to 2 decimal places, and Fixed Cost to the nearest dollar.) 2(a) Using direct labor-hours as the independent variable, prepare a scattergraph that plots direct labor-hours on the horizontal axis and utilities cost on the vertical axis Instructions: 1. On the graph below, use the point tool (Year 1-1st quarter) to plot direct labor-hours on the horizontal axis and utilities cost on the Vertical axis. 2. Repeat the same process for the plotter tools (Year 1-2nd quarter to Year 2-4th quarter). 3. To enter exact coordinates, double click on the point and enter the values of x and y 4. To remove a point from the graph, click on the point and select delete option. Year 1 First 20333353 140000 Year 1 Second 120000 Year 1 Third 100000 o 80000 Fourth Year 2 First 40000 140000 Year 1 Second 120000 100000 Year 1 Third O 80000 Year 1 Fourth E 60000 Year 2 Firs 40000 20000 Year 2 0 2000 4000 60008000 10000 12000 14000 Year 2 Third Direct Labor-Hours reset 2(b). Determine a cost formula for utilities cost using least-squares regressign. Exp-ess this cost formula in the form Y a+bX. (Round the Variable cost to 2 decimal places, and Fixed Cost to the nearest dollar.) 2 Would you recommend that the company use tons mined or direct apo thours as a oase for planning ilities cos:? Tors m.ned