

Answered step by step
Verified Expert Solution
Question
1 Approved Answer
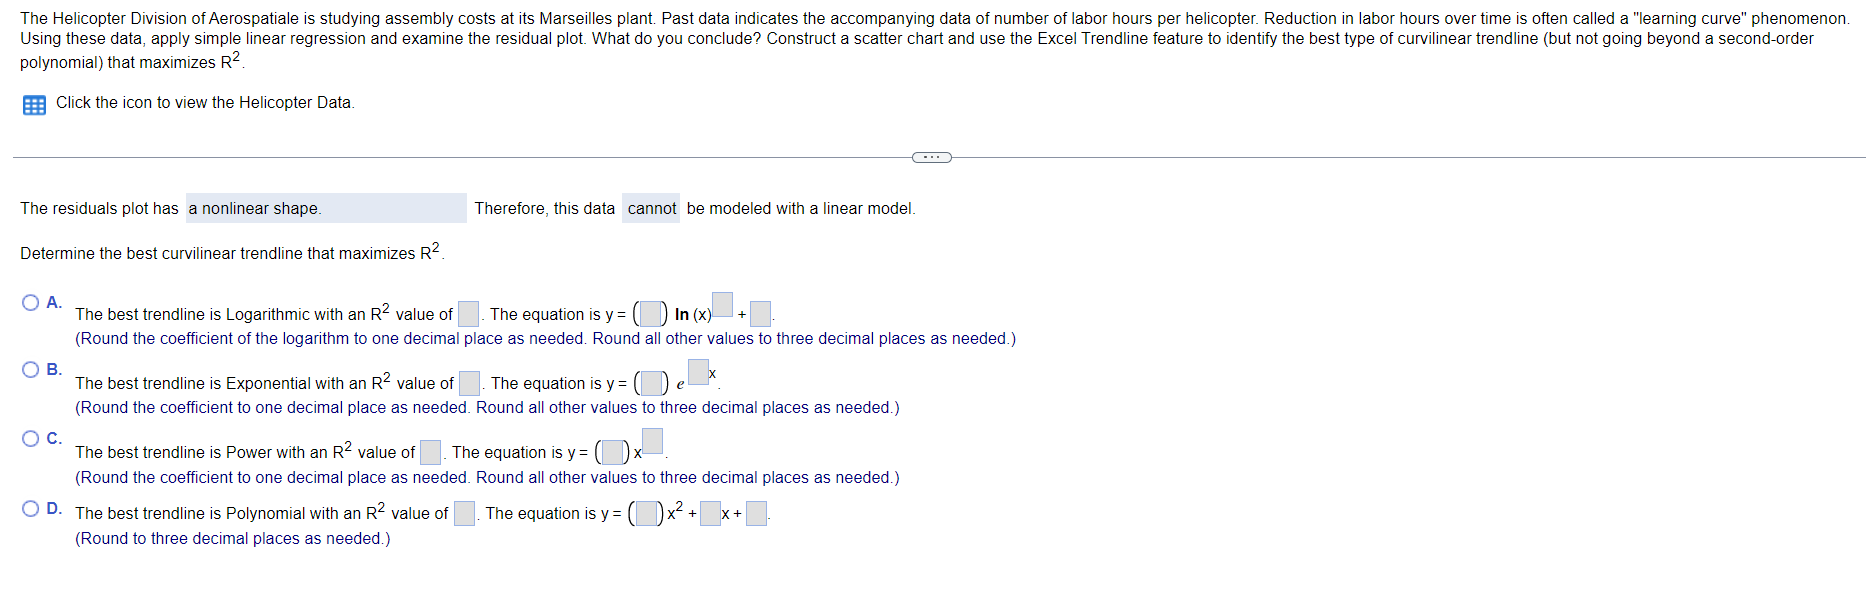
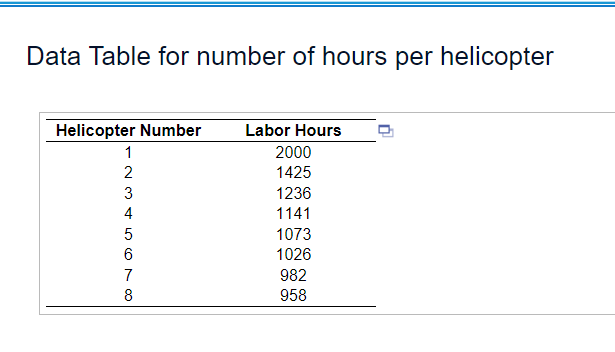
The Helicopter Division ofAerospatiale is studying assembly costs at its Marseilles plant Past data indicates the accompanying data of number of labor hours per helicopter,
Step by Step Solution
There are 3 Steps involved in it
Step: 1

Get Instant Access to Expert-Tailored Solutions
See step-by-step solutions with expert insights and AI powered tools for academic success
Step: 2

Step: 3
Ace Your Homework with AI
Get the answers you need in no time with our AI-driven, step-by-step assistance
Get Started
WebAssign For Trigonometry
Authors: Ron Larson
10th Edition
1337879622, 9781337879620