

Answered step by step
Verified Expert Solution
Question
1 Approved Answer
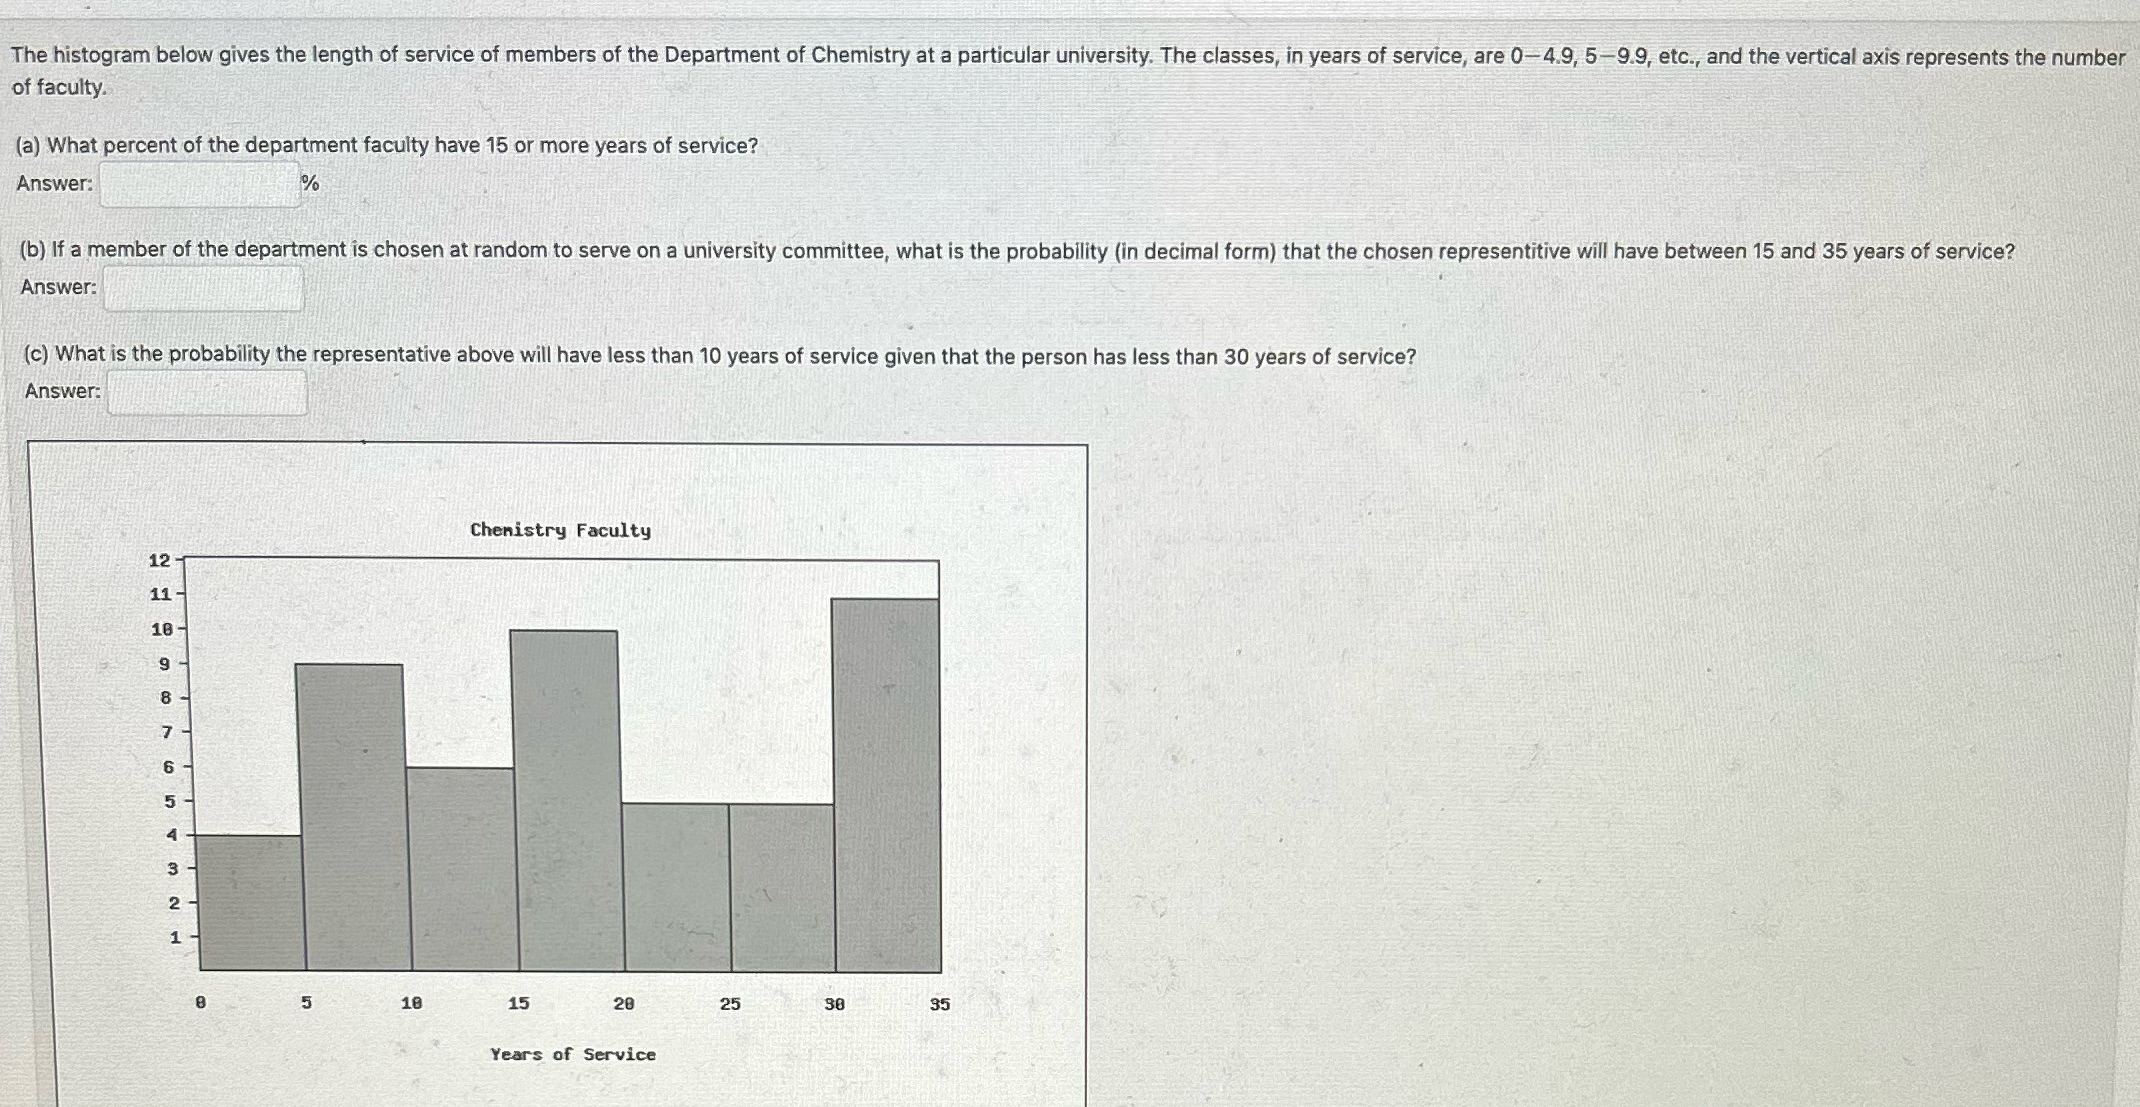
The histogram below gives the length of service of members of the Department of Chemistry at a particular university. The classes, in years of service,
Step by Step Solution
There are 3 Steps involved in it
Step: 1

Get Instant Access to Expert-Tailored Solutions
See step-by-step solutions with expert insights and AI powered tools for academic success
Step: 2

Step: 3
Ace Your Homework with AI
Get the answers you need in no time with our AI-driven, step-by-step assistance
Get Started
Linear Algebra With Applications
Authors: W. Keith Nicholson
7th Edition
978-0070985100, 70985103