Answered step by step
Verified Expert Solution
Question
1 Approved Answer
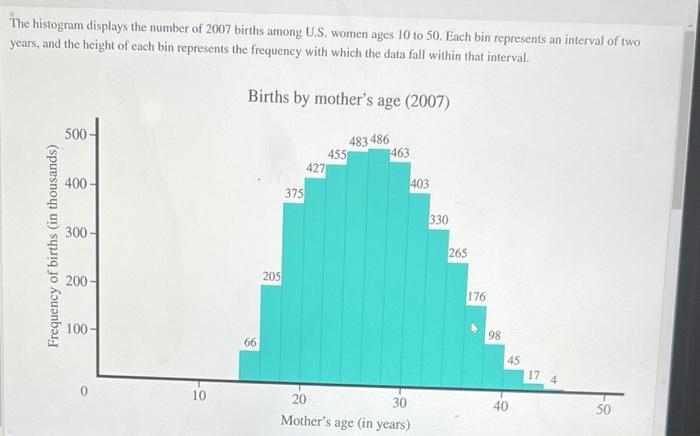
The histogram displays the number of 2007 births among U.S. women ages 10 to 50. Each bin represents an interval of two years, and


The histogram displays the number of 2007 births among U.S. women ages 10 to 50. Each bin represents an interval of two years, and the height of each bin represents the frequency with which the data fall within that interval. Births by mother's age (2007) 500- 483 486 455 463 427 400 - 403 375 330 300 265 200 205 176 100- 98 66 45 17 4. 10 20 30 40 50 Mother's age (in years) Frequency of births (in thousands) Use the provided histogram to answer questions about the number of births for each age group. How many births occurred among women over the age of 40? number of births: What percentage of births occurred among women between the ages of 38 and 40? Give your answer to one decimal place. percentage of births: What does the histogram tell you about the ages at which women gave birth in 2007? Women between the ages of 26 and 28 gave birth more often than any other age group. Four women between the ages of 44 and 46 gave birth in 2007. The distribution of ages at which women gave birth is roughly symmetric.
Step by Step Solution
★★★★★
3.51 Rating (161 Votes )
There are 3 Steps involved in it
Step: 1
First question Number of births among women over the age of 40 will be 45174 66 Second ques...
Get Instant Access to Expert-Tailored Solutions
See step-by-step solutions with expert insights and AI powered tools for academic success
Step: 2

Step: 3

Ace Your Homework with AI
Get the answers you need in no time with our AI-driven, step-by-step assistance
Get Started


