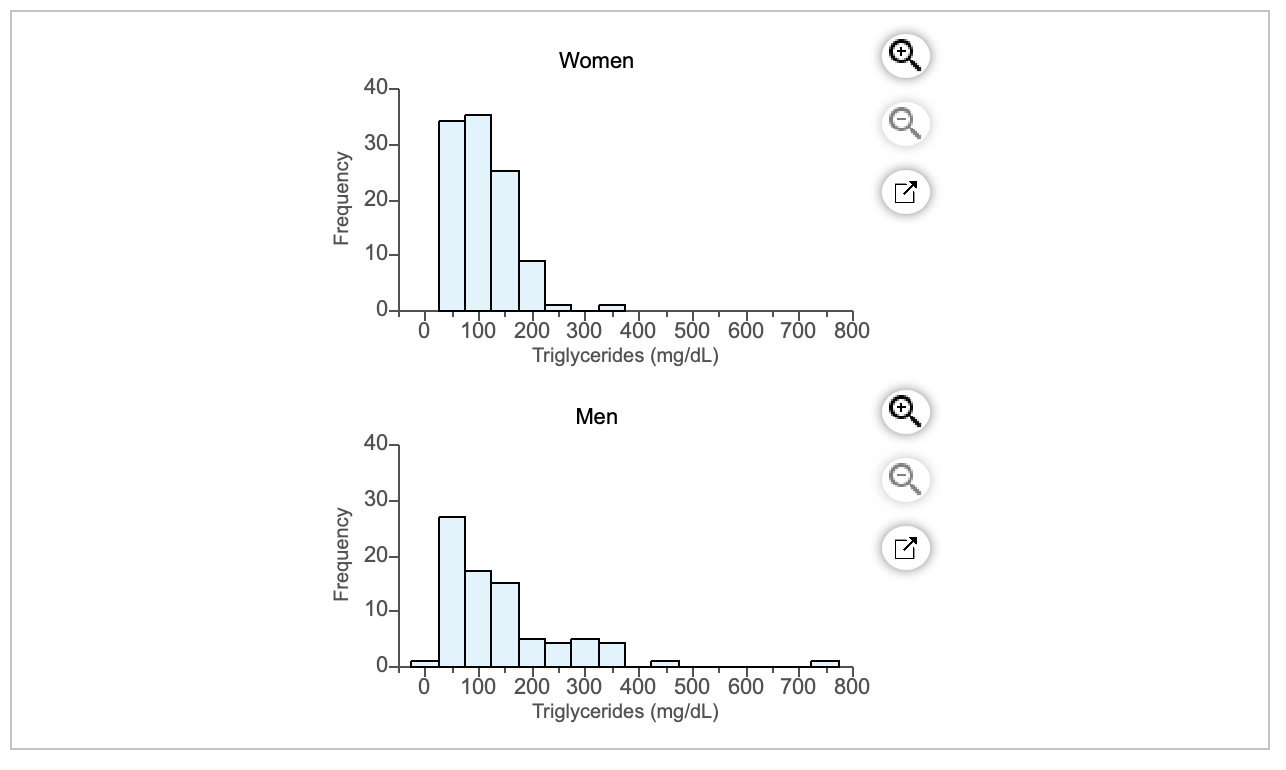
The histograms show triglyceride levels for 80 men and 105 women. Triglycerides are a form of fat found in blood. Complete parts?(a) and?(b) below.
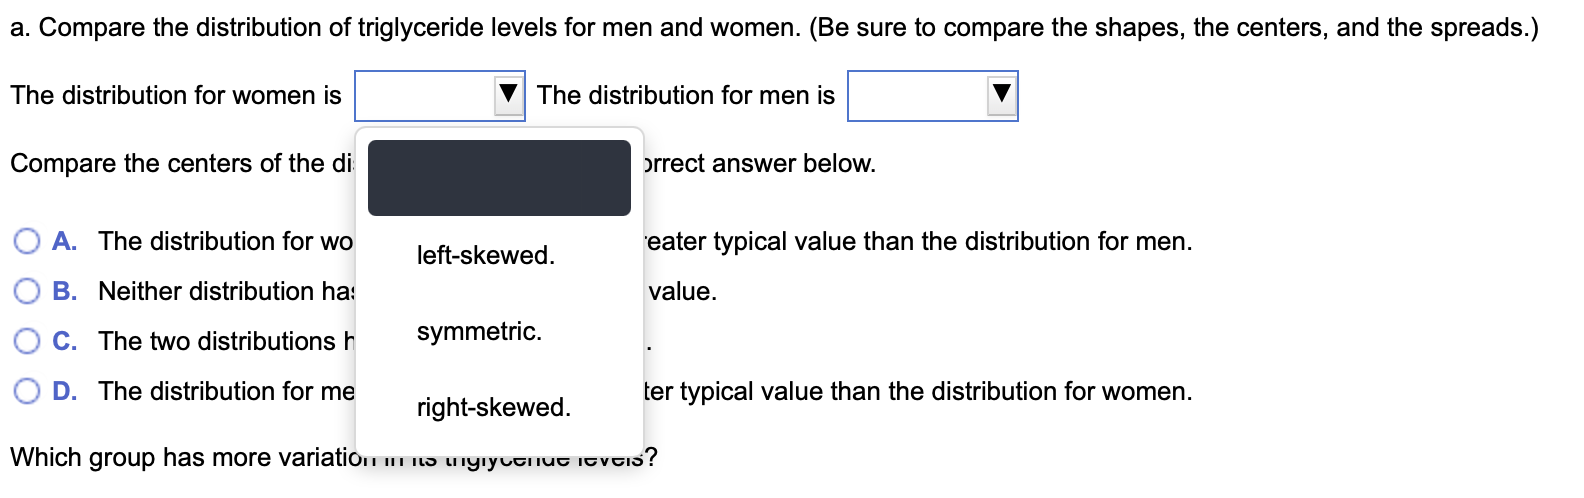
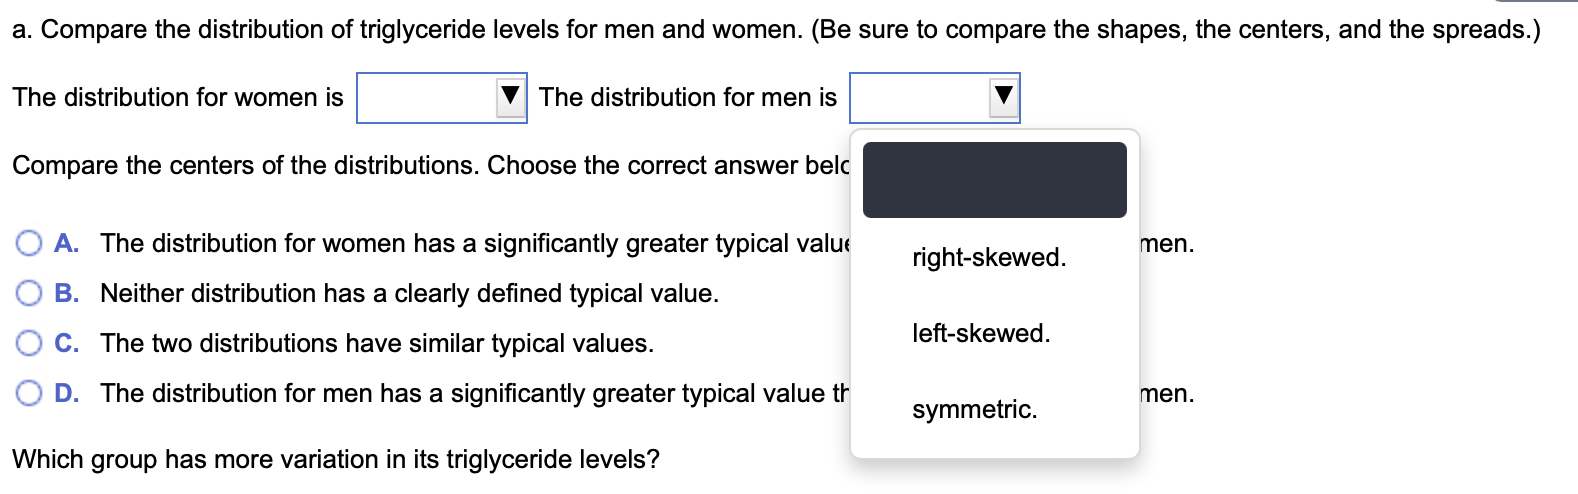
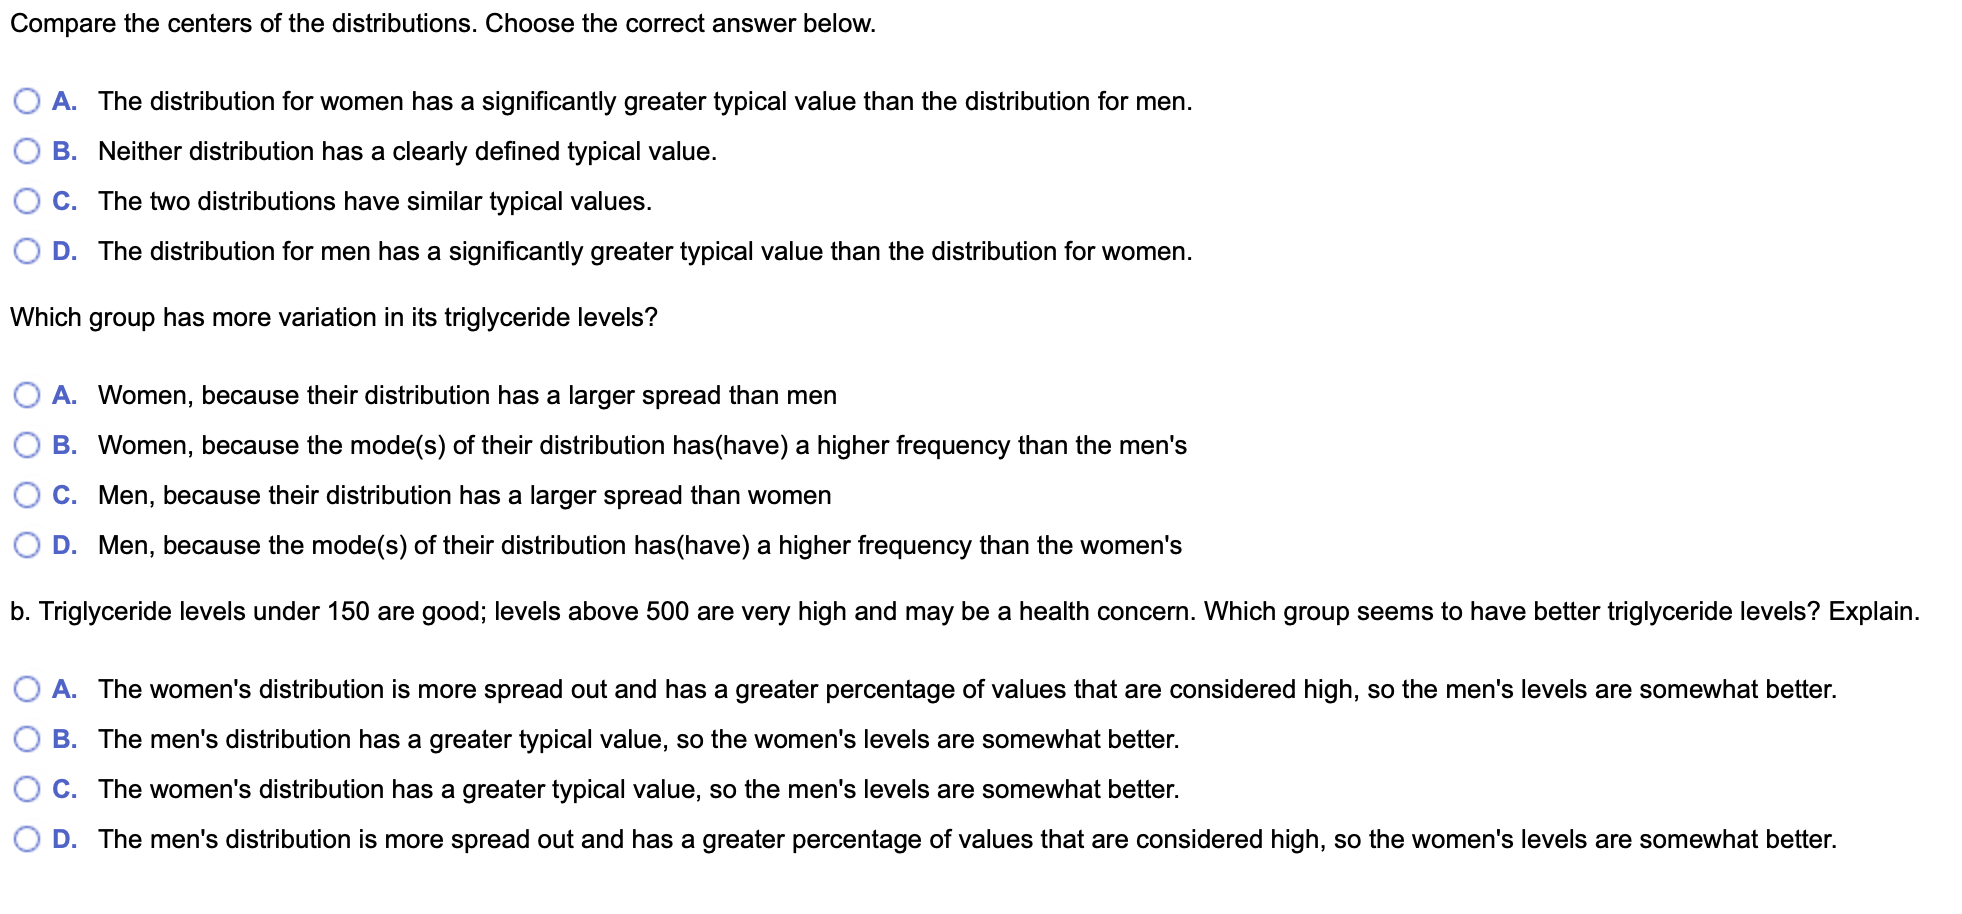
Women + 40- Frequency 100 200 300 400 500 600 700 800 Triglycerides (mg/dL) Men 40- 30- Frequency 20- 100 200 300 400 500 600 700 800 Triglycerides (mg/dL)a. Compare the distribution of triglyceride levels for men and women. (Be sure to compare the shapes, the centers, and the spreads.) The distribution for women is |:| The distribution for men is |:| Compare the centers of the di: - Jrrect answer below. O A. The distribution for we | eftskew e d 'eater typical value than the distribution for men. O B. Neither distribution ha: value. 0 c. The two distributions h Symmetric- O D. The distribution for me ter typical value than the distribution for women. right-skewed. Which group has more VariatiOIl Ill no ulgrywnuv IGVGIO'? a. Compare the distribution of triglyceride levels for men and women. (Be sure to compare the shapes, the centers, and the spreads.) The distribution for women is The distribution for men is Compare the centers of the distributions. Choose the correct answer belc O A. The distribution for women has a significantly greater typical value right-skewed. men. O B. Neither distribution has a clearly defined typical value. O C. The two distributions have similar typical values. left-skewed. O D. The distribution for men has a significantly greater typical value th men. symmetric. Which group has more variation in its triglyceride levels?Compare the centers of the distributions. Choose the correct answer below. O A. The distribution for women has a signicantly greater typical value than the distribution for men. O B. Neither distribution has a clearly dened typical value. 0 C. The two distributions have similar typical values. O D. The distribution for men has a signicantly greater typical value than the distribution for women. Which group has more variation in its triglyceride levels? O A. Women, because their distribution has a larger spread than men 0 B. Women, because the mode(s) of their distribution has(have) a higher frequency than the men's O C. Men, because their distribution has a larger spread than women O D. Men, because the mode(s) of their distribution has(have) a higher frequency than the women's b. Triglyceride levels under 150 are good; levels above 500 are very high and may be a health concern. Which group seems to have better triglyceride levels? Explain. O A. The women's distribution is more spread out and has a greater percentage of values that are considered high, so the men's levels are somewhat better. O B. The men's distribution has a greater typical value, so the women's levels are somewhat better. 0 C. The women's distribution has a greater typical value, so the men's levels are somewhat better. O D. The men's distribution is more spread out and has a greater percentage of values that are considered high, so the women's levels are somewhat better