

Answered step by step
Verified Expert Solution
Question
1 Approved Answer
The historical returns for two investments_A and B-are summarized in the following table for the period 2016 to 2020, Use the data to answer the
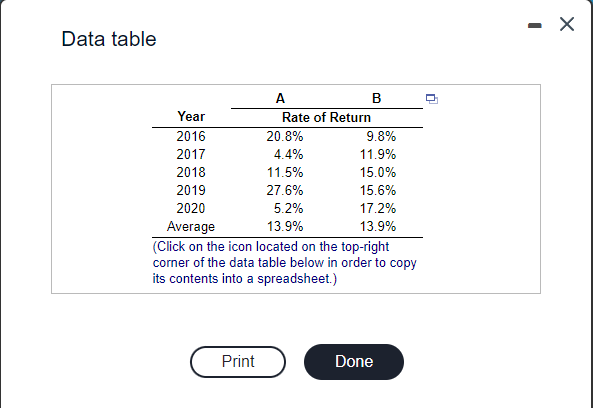 The historical returns for two investments_A and B-are summarized in the following table for the period 2016 to 2020, Use the data to answer the questions that follow. a. On the basis of a review of the return data, which investment appears to be more risky? Why? b. Calculate the standard deviation for each investment's returns. c. On the basis of your calculations in part b, which investment is more risky? Compare this conclusion to your observation in part a. Data table corner of the data table below in order to copy its contents into a spreadsheet.)
 Step by Step Solution
There are 3 Steps involved in it
Step: 1

Get Instant Access to Expert-Tailored Solutions
See step-by-step solutions with expert insights and AI powered tools for academic success
Step: 2

Step: 3
Ace Your Homework with AI
Get the answers you need in no time with our AI-driven, step-by-step assistance
Get Started
Computational Intelligence In Economics And Finance Volume II
Authors: Paul P. Wang, Tzu-Wen Kuo
2007th Edition
3540728201, 978-3540728207